teaching_llm_applications
Softmax and temperature
\[softmax(x) = \frac{e^{x_i}}{\sum_j e^{x_j}}\]-
Intuition: turns logits into a probability distribution
-
Why we need it? To convert raw logits into probabilities that sum to 1.
🤔 ❓ Question for class
-
softmaxlearns to dump attention on first token -
if you remove that token what happens to the model? Does it change the subsequent token predictions?
-
nowadays there is a dedicated
sink tokentoken used to improve training stability
Recent improvements to Softmax
-
🤔 What do you think softmax can be improved on?
-
Hint: it has an exponential and a division. Can you think of alternatives?
-
see architecture for more tricks on how to make softmax better
Temperature
- Temperature is just a hyperparameter that scales the logits before applying softmax.
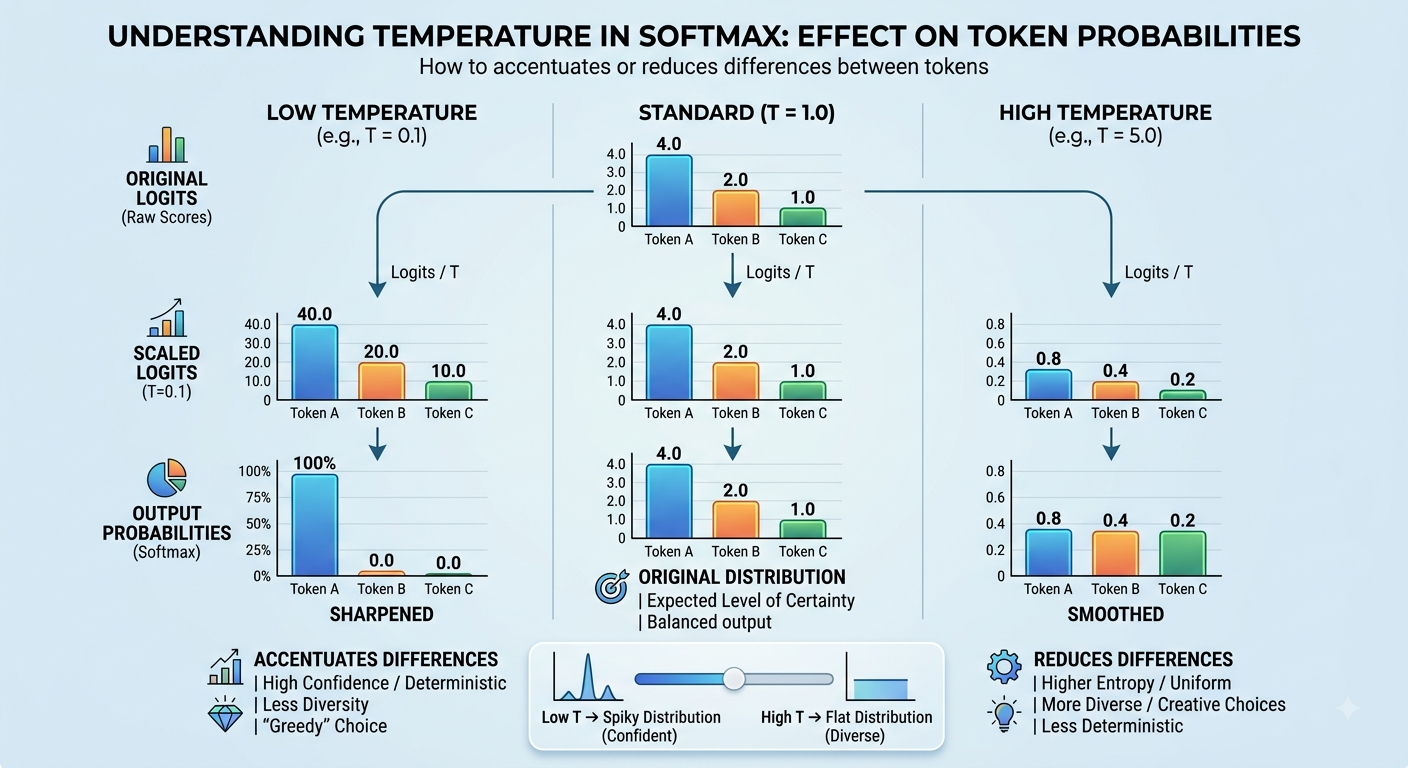
- It controls the randomness of the model’s predictions.
- Formula:
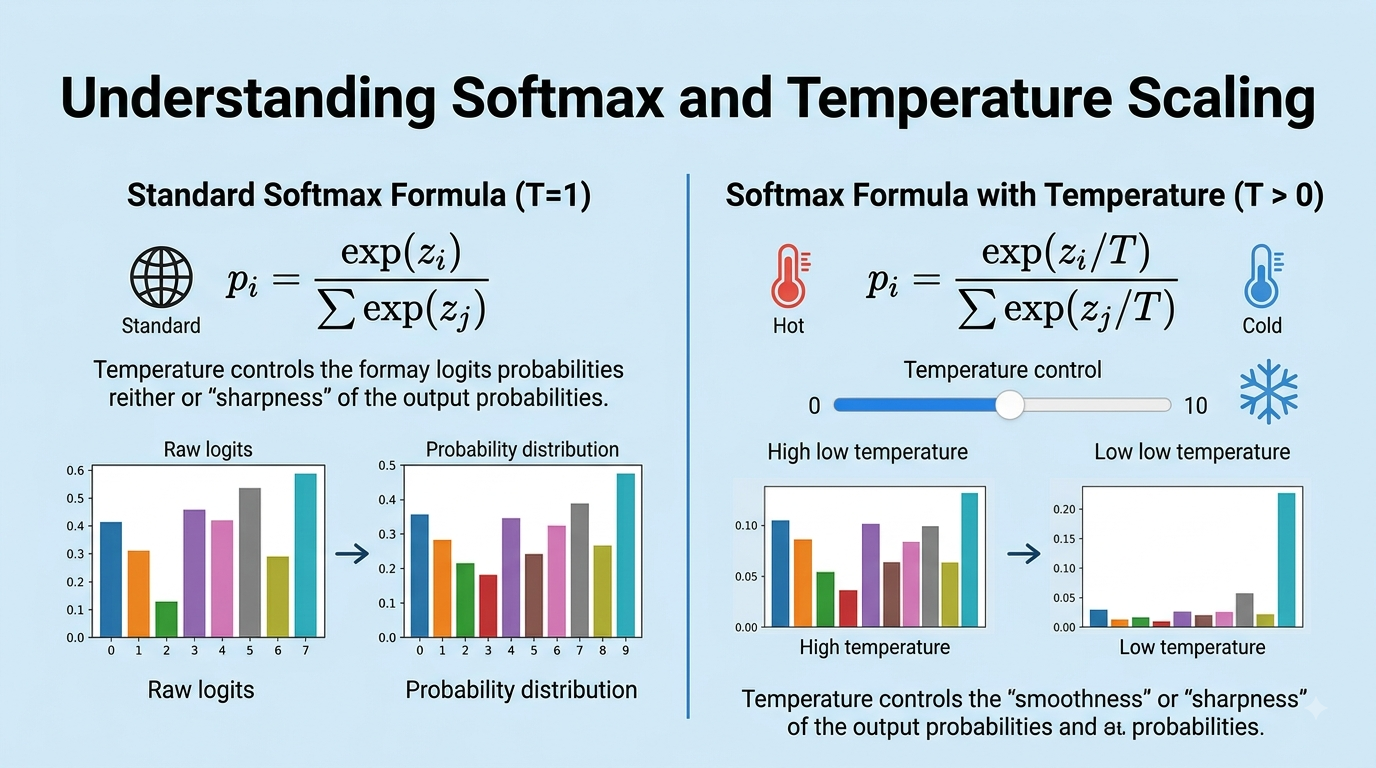
- Raw Logits ($z_i$): These are the unnormalized output scores from a model. Higher scores indicate higher confidence in a particular class.
- Softmax Function: Converts logits into probabilities that sum to 1. The formula with temperature is: \(P_i = \frac{e^{z_i / T}}{\sum_{j} e^{z_j / T}}\)
- Temperature ($T$):
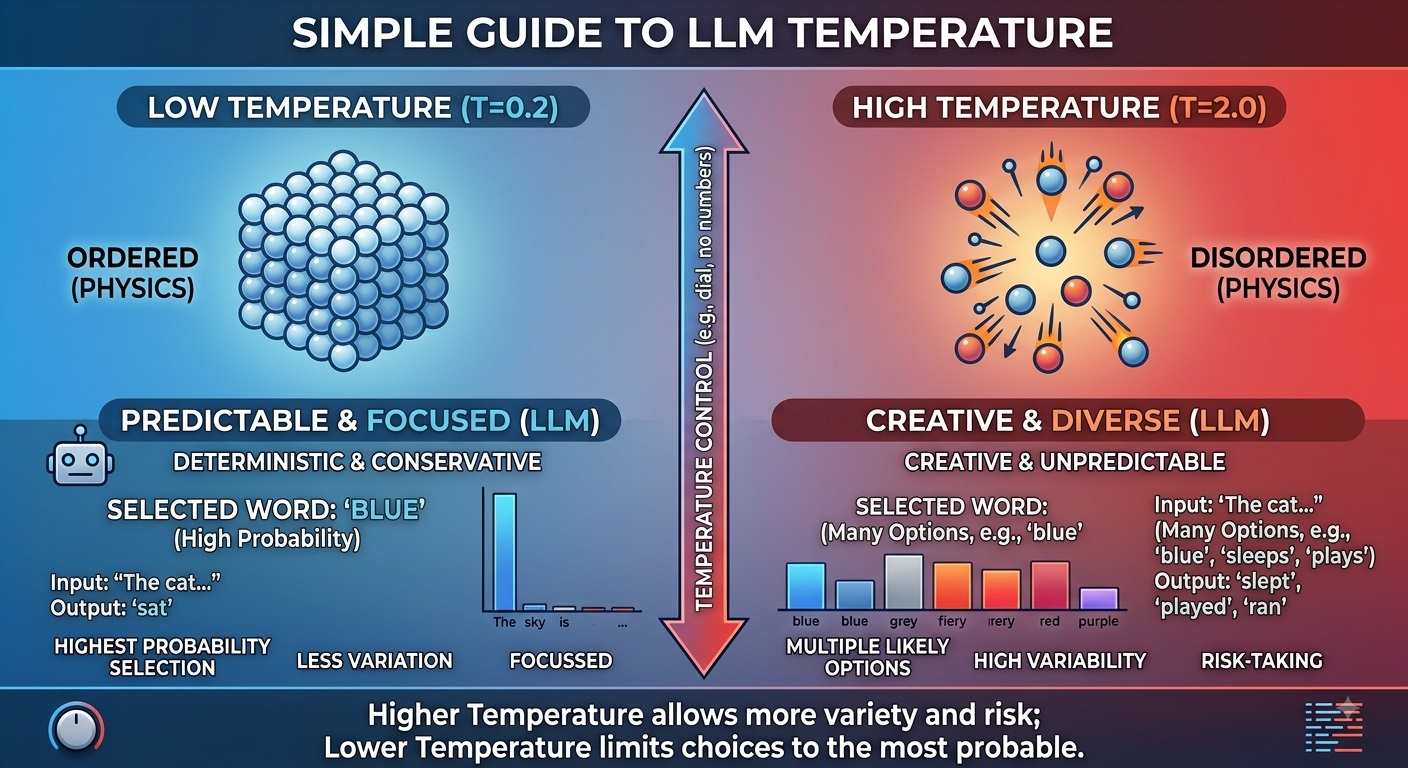
- Low Temperature ($T < 1$): Makes the distribution “sharper” or more peaky. The model becomes more confident in its top choice, effectively becoming “greedy.”
- High Temperature ($T > 1$): Makes the distribution “flatter” or more uniform. The model becomes less confident and explores other options, increasing diversity.
- Why is it called temperature?
- This is a term from physics
🎮 Practical
-
paste the following code into Google Colab and play around with the sliders
-
or click on the link here
-
or here
import numpy as np
import matplotlib.pyplot as plt
from ipywidgets import interact, FloatSlider

# Sample tokens and raw logits (unnormalized log-probabilities)
tokens = ['Cat', 'Dog', 'Car', 'Airplane', 'Tree']
logits = np.array([3.5, 2.8, 1.2, 0.5, -1.0])

def softmax_with_temperature(logits, temperature):
    # Clamp temperature to avoid division by zero
    temp = max(temperature, 1e-5)
    # Scaled logits with numerical stability adjustment
    scaled_logits = logits / temp
    exp_logits = np.exp(scaled_logits - np.max(scaled_logits))
    return exp_logits / np.sum(exp_logits)

def plot_interactive(temperature=1.0):
    probs = softmax_with_temperature(logits, temperature)

    fig, (ax1, ax2) = plt.subplots(1, 2, figsize=(13, 4.5))

    # 1. Plot Raw Logits
    bars1 = ax1.bar(tokens, logits, color='#4C72B0', edgecolor='black', alpha=0.85)
    ax1.set_title('1. Raw Logits ($z_i$)', fontsize=13, fontweight='bold')
    ax1.set_ylabel('Score')
    ax1.grid(axis='y', linestyle='--', alpha=0.5)

    for bar in bars1:
        yval = bar.get_height()
        ax1.text(bar.get_x() + bar.get_width()/2, yval + 0.1, f"{yval:.1f}", ha='center', va='bottom')

    # 2. Plot Output Probabilities
    bars2 = ax2.bar(tokens, probs, color='#DD8452', edgecolor='black', alpha=0.85)
    ax2.set_title(f'2. Softmax Probabilities ($T = {temperature:.2f}$)', fontsize=13, fontweight='bold')
    ax2.set_ylabel('Probability')
    ax2.set_ylim(0, 1.1)
    ax2.grid(axis='y', linestyle='--', alpha=0.5)

    for bar in bars2:
        yval = bar.get_height()
        ax2.text(bar.get_x() + bar.get_width()/2, yval + 0.02, f"{yval*100:.1f}%", ha='center', va='bottom')

    plt.tight_layout()
    plt.show()

# Render interactive widget
interact(
    plot_interactive,
    temperature=FloatSlider(
        value=1.0,
        min=0.05,
        max=3.0,
        step=0.05,
        description='Temp (T):',
        style={'description_width': 'initial'},
        layout={'width': '500px'}
    )
);