teaching_web_development
HCI principles and universal accessibility
Human-Computer Interaction (HCI) is a multidisciplinary field focused on the design and use of computer technology, particularly the interfaces between people (users) and computers. The goal of HCI is to create systems that are efficient, effective, and satisfying for users.
Key Principles of HCI
-
User-Centered Design: Designing systems with the needs, preferences, and limitations of end-users in mind.
-
Consistency: Ensuring that similar operations and elements behave in similar ways across the system to reduce the learning curve.
-
Feedback: Providing users with clear and immediate feedback on their actions to help them understand the results of their interactions.
-
Affordance: Designing elements in a way that suggests their functionality (e.g., buttons should look clickable).
-
Error Prevention and Recovery: Designing systems to minimize the chances of user errors and providing easy ways to recover from them.
-
Flexibility and Efficiency of Use: Allowing users to customize their interactions and providing shortcuts for experienced users.
-
Aesthetic and Minimalist Design: Keeping interfaces clean and uncluttered to avoid overwhelming users with unnecessary information.
Universal Accessibility
Universal accessibility refers to the design of products, devices, services, or environments for people with disabilities. The goal is to ensure that everyone, regardless of their abilities or disabilities, can access and use technology effectively.
Principles of Universal Accessibility
-
Perceivable: Information and user interface components must be presented in ways that users can perceive, regardless of their sensory abilities (e.g., providing text alternatives for images).
-
Operable: User interface components and navigation must be operable by all users, including those with motor impairments (e.g., ensuring that all functionality is available from a keyboard).
-
Understandable: Information and the operation of the user interface must be understandable to all users (e.g., using clear and simple language).
-
Robust: Content must be robust enough to be interpreted reliably by a wide variety of user agents, including assistive technologies (e.g., ensuring compatibility with screen readers).
Best Practices for Universal Accessibility
- Use semantic HTML to ensure that content is structured logically.
- Provide alternative text for images and multimedia content.
- Ensure sufficient color contrast between text and background.
- Design for keyboard navigation and avoid relying solely on mouse interactions.
- Test interfaces with assistive technologies such as screen readers.
UX design
-
User Experience (UX) design focuses on enhancing user satisfaction by improving the usability, accessibility, and pleasure provided in the interaction between the user and the product.
-
Good UX design considers the entire user journey, from initial contact to final interaction.
Interaction Design
- Interaction design is a subset of UX design that focuses specifically on the design of interactive digital products and services. It involves creating engaging interfaces with well-thought-out behaviors.
Wireframing and Prototyping
- Wireframing is the process of creating a visual guide that represents the skeletal framework of a digital product. It helps in planning the layout and functionality before detailed design and development.
- Prototyping involves creating an early model of a product to test and validate design concepts and user interactions.
- 💡 Use Miro or Figma for wireframing and prototyping.
Information Architecture
- Information architecture (IA) is the practice of organizing and structuring content in a way that makes it easy for users to find and navigate information.
- Good IA enhances usability and helps users understand where they are within a digital product.
Sitemaps and Navigation Design
- Sitemaps are visual representations of the structure of a website or application, showing the relationships between different pages and sections.
- Navigation design focuses on creating intuitive and efficient ways for users to move through a digital product.
- Draw.io can be used to create sitemaps and navigation flows.
- digestwebdesign.com article on IA
Storyboarding
- Storyboarding is a technique used to visualize the user journey and interactions with a product through a series of illustrations or images.
- It helps designers understand user needs and behaviors, and plan the overall experience.
- Sample tool: Canva Storyboard Maker
Design Patterns
- Design patterns are reusable solutions to common design problems. They provide a standard way of solving specific design challenges and can improve consistency across a product.
- Examples include navigation menus, search bars, and form layouts.
- UI Patterns: A collection of design patterns for user interfaces.
Accessibility
- Resources
- W3C Web Accessibility Initiative (WAI): Comprehensive resources and guidelines for web accessibility.
- A11y Project: A community-driven effort to make web accessibility easier.
The elements of user experience
-
📚 📝 The User Experience: A detailed look at the components of user experience design.
- 🚀 Concept The elements of user experience framework, developed by Jesse James Garrett, outlines five key planes of user experience design: Strategy, Scope, Structure, Skeleton, and Surface.
- The User Experience: A detailed look at the components of user experience design.
-
This framework helps designers understand the different aspects of user experience and how they interrelate.
- Each plane builds upon the previous one, starting with the overall strategy and moving down to the visual design of the interface.
-
Plan your project so that work on each plane is completed before moving to the next.
-
🤔 When the Web started, there were two groups of people: one saw Web pages as documents (and applied principles from traditional media such as publishing), the other saw them as applications (and applied principles from desktop applications).
- Today, most Web sites are a mixture of both.
Duality of Web as document and application
- Web as Document: Focuses on delivering content, such as articles, images, and videos. The primary goal is to inform or entertain the user.
- Web as Application: Emphasizes tasks: interactivity and functionality, allowing users to perform tasks such as filling out forms, making purchases, or using web-based software.
- Designers must balance these two aspects to create effective and engaging web experiences.
Human centered design
- Human-Centered Design (HCD) is an approach to problem-solving that prioritizes the needs, preferences, and limitations of end-users throughout the design process.
- HCD involves understanding users through research, involving them in the design process, and iteratively testing and refining solutions based on user feedback.
- The goal of HCD is to create products and services that are not only functional but also enjoyable and accessible for the people who use them.
Design thinking
- Design Thinking is a problem-solving approach that emphasizes empathy, creativity, and iterative testing. It involves five key stages: Empathize, Define, Ideate, Prototype, and Test.
- Design Thinking encourages designers to deeply understand user needs, generate a wide range of ideas, and create prototypes to test and refine solutions.
- This approach fosters innovation and helps create user-centered products and services.
User experience design process
- Research: Understand the users, their needs, and the context of use through methods such as interviews, surveys, and observations.
- Define: Synthesize research findings to define user personas, scenarios, and requirements.
- Ideate: Generate a wide range of ideas and potential solutions through brainstorming and other creative techniques.
- Prototype: Create low-fidelity and high-fidelity prototypes to visualize and test design concepts.
- Test: Conduct usability testing with real users to gather feedback and identify areas for improvement.
- Implement: Work with developers to bring the design to life, ensuring that the final product meets user needs and design specifications.
- Evaluate: Continuously assess the user experience post-launch and make iterative improvements based on user feedback and analytics.
A diagram of the process can be found here.
Usability 101 by Jakob Nielsen
- Jakob Nielsen, a renowned usability expert, has outlined ten key principles for designing usable interfaces:
- Visibility of system status: Keep users informed about what is going on through appropriate feedback within a reasonable time.
- Match between system and the real world: Use language and concepts familiar to users, following real-world conventions.
- User control and freedom: Provide users with the ability to undo and redo actions easily.
- Consistency and standards: Follow platform conventions and maintain consistency throughout the interface.
- Error prevention: Design systems to prevent errors from occurring in the first place.
- Recognition rather than recall: Minimize the user’s memory load by making objects, actions, and options visible.
- Flexibility and efficiency of use: Allow users to tailor frequent actions and provide shortcuts for experienced users.
- Aesthetic and minimalist design: Avoid unnecessary information and focus on essential elements.
- Help users recognize, diagnose, and recover from errors: Use clear error messages and provide constructive solutions.
- Help and documentation: Provide easily accessible help and documentation when needed.
- A diagram summarizing these is shown here
Prototyping (A powerful tool for HCI)
-
Protyotyping grounds communication.
-
Communicating to stakeholders.
-
🧩🚀 Concept Serves as a common ground.
-
🤔❓ Example: Kodak built a quick prototype to show what a digital camera can do.
-
It is incomplete. It is like a sketch.
-
Buxton Sketching User Experiences book.
-
The number of possibilities narrows as time goes on. This is shown in the figure below:
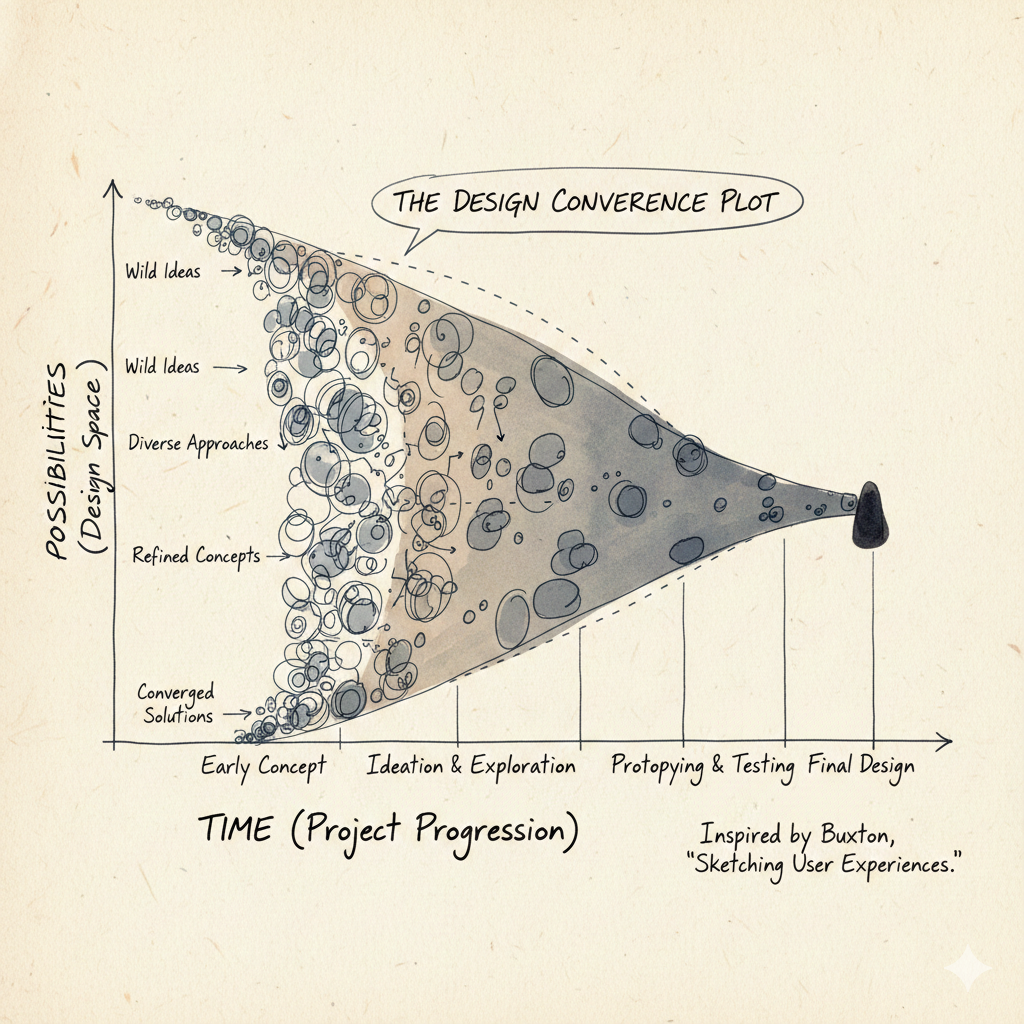
- In the 1990s Jeff Hawkins was prototyping the Palm Pilot. He built a wooden prototype to test the size and shape of the device (form factor).

-
🧩🚀 Concept Try lots of different ideas quickly.
-
Cost of change increases as time goes on.
-
Biggest changes should be made early.
🎮🛠️ Activity (power of prototypes)
-
🎮🛠️ Listen to this great TEDx talk by Scott Klemmer
-
Never go to a meeting without a prototype
-
🧩🚀 Prototypes are like postcards from the future
Usability studies
-
How are users going to use the system?
-
Usability studies involve observing and analyzing how real users interact with a product or system to identify usability issues and areas for improvement.
-
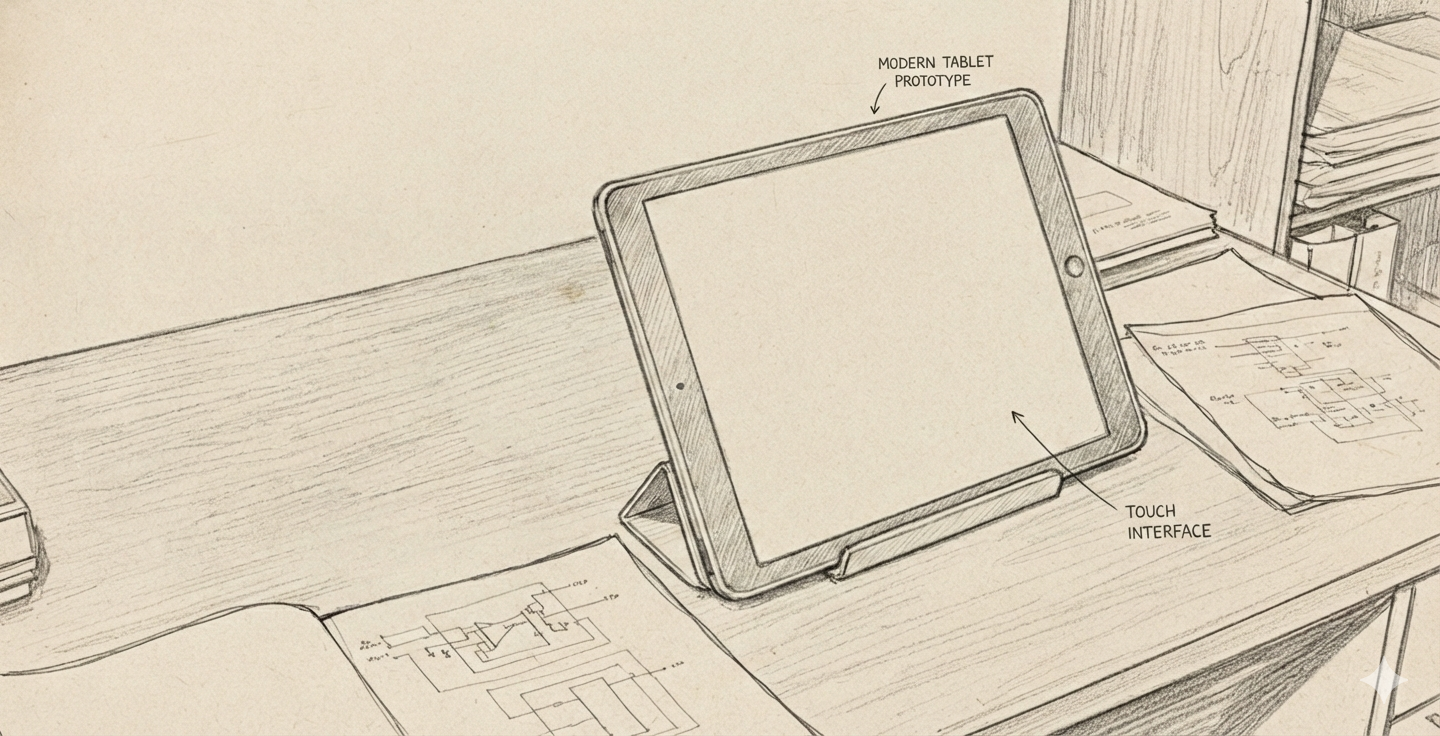
Alan Kay prototyped the Dynabook concept in the 1970s. He built a physical model to demonstrate the idea of a portable computer for learning.
📚📝 Software
- Figma: A collaborative interface design tool for creating wireframes, prototypes, and design systems.
- Miro: An online collaborative whiteboard platform for brainstorming, wireframing, and planning.
- Canva Storyboard Maker: A tool for creating storyboards to visualize user journeys and interactions.
Birth of HCI
-
Field started with Vannevar Bush’s 1945 article “As We May Think” in The Atlantic Monthly.
-
🤔❓
Memexconcept: a personal device to store and retrieve information using associative links. All the world’s knowledge stored and accessed easily. Remind you of something? -
🧩🚀 Concept You could use
machinesto extend the power of the human mind. -
Analog device designed to serve as a mechanized extension of human memory.
-
Desk-like workstation equipped with translucent screens and microfilm storage. The device was intended to house a user’s entire personal library of books, records, and communications, providing a solution to the “information explosion” of the post-war era by making vast amounts of data instantly retrievable.
-
The true breakthrough of the Memex was the concept of associative indexing, which served as the conceptual blueprint for the modern hyperlink. Bush realized that the human mind operates by association rather than by rigid, alphabetical, or numerical filing. The Memex would allow a user to create “trails” of related information, permanently linking two items together so that pulling up one would automatically lead to the other. By mirroring the nonlinear nature of human thought, the Memex aimed to transform a static archive into a dynamic, personalized web of knowledge.

-
This motivated the birth of the World Wide Web.
-
Graphical User Interface (GUI) invented at Xerox PARC in the 1970s.
-
Ivan Sutherland’s 1963 Sketchpad system was an early pioneering computer program that introduced the concept of graphical user interfaces (GUIs) and interactive computer graphics. It allowed users to create and manipulate graphical objects directly on a computer screen using a light pen, laying the groundwork for interactive computing.
-
Followed by Douglas Engelbart’s 1962 report “Augmenting Human Intellect: A Conceptual Framework”. He demonstrated the oN-Line System (NLS) in 1968, which featured hypertext linking, video conferencing, and a mouse-driven cursor.
-
Alan Kay at Xerox PARC envisioned the Dynabook in the 1970s, a portable, personal computer for learning and creativity, which laid the conceptual foundation for modern laptops and tablets.
-
It is the 1980s. It is now 40 years since Vannavar Bush’s article.
-
The Long Nose of Innovationby Buxton. -
The power of prototypes.
Participant observation
Video lecture on participant observation
-
“You can observe a lot by watching” - Yogi Berra
-
App for truck drivers needs to have big icons and buttons, and stylus since they will be wearing gloves.
-
Deep hanging out
-
Be a good apprentice
-
Look around for workarounds. For example, post-it notes on printers reminding people how to use it. That could be an opportunity for improving the device.
-
Anthropologists/ethnographers studying how people used fax machine at Xerox PARC. We assume that if people cannot use a technology, they are “dumb”. However maybe the technology has been designed well enough.
-
Walmart asked users in a survey if they would like the aisle to be less cluttered? Please note that they did not ask how the users used the facilities and asked them a leading question. This actually let them to declutter the aisles and eventually led to decline in sales!
Experience economy
-
Pine, B. Joseph, and James H. Gilmore. “Welcome to the experience economy.” Harvard business review 76 (1998): 97-105.https://hbr.org/1998/07/welcome-to-the-experience-economy
-
The experience economy is a concept that suggests businesses should focus on creating memorable experiences for customers rather than just providing goods or services.
-
Previously , economies evolved from agrarian to industrial to service-based. The next stage is the experience economy, where the focus is on engaging customers through unique and personalized experiences.
-
In the context of HCI and UX design, this means designing digital products and services that engage users on an emotional level, creating positive and lasting impressions.
-
By prioritizing user experience and emotional engagement, businesses can differentiate themselves in a competitive market and build stronger relationships with their customers.
Interviewing participants
-
What makes something interesting? Anything can be interesting. Even a washing machine.
-
Talk with the right people. Not the top echelons. But the people in the middle. (
Malcom Gladwell) -
Do not ask leading questions : Would you like a daily update?
-
Sometimes users do not know what they want. Heny Ford had said:
If you asked users in 1800s what they wanted, they would have said a faster horse. -
Concept: 🧩🚀 The designer knows the possibilities, but the user does not
-
Instead ask users about their daily lives
-
Ask good questions (open ended questions)
_ Silence is golden. Listen to the users and give them time to reflect and respond.
Interview techniques
-
Diaries. Keep interviewees diaries which they write.
-
Followup. Remind people.
-
Meet people regularly.
-
Lead users. Designers help lead users come up with good solutions. Doctors come up with innovative solutions.
-
Create personas of users. Models of different kinds of users.
Creating design goals
-
Design transforms existing solutions to preferable ones.
-
Example of ants (Herb Simon). Much of the complex behaviour of ants comes from the environment.
-
All design is redesign.
-
Gives you a conceptual model
-
Activity analysis: what are the pain points? What are the goals?
-
⚠️ For example, Goal - get bread, subgoals - get in car, turn ignition. Questions for redesign - do need a physical key? Can we get remote/drone powered delivery to home?
-
Activity design - will users actually use this? will it accomplish something that people need doing? doing taxes etc.
-
💡 We design artefacts (apps, phones) not activities
Storyboarding
Video by Scott Klemmer on storyboards
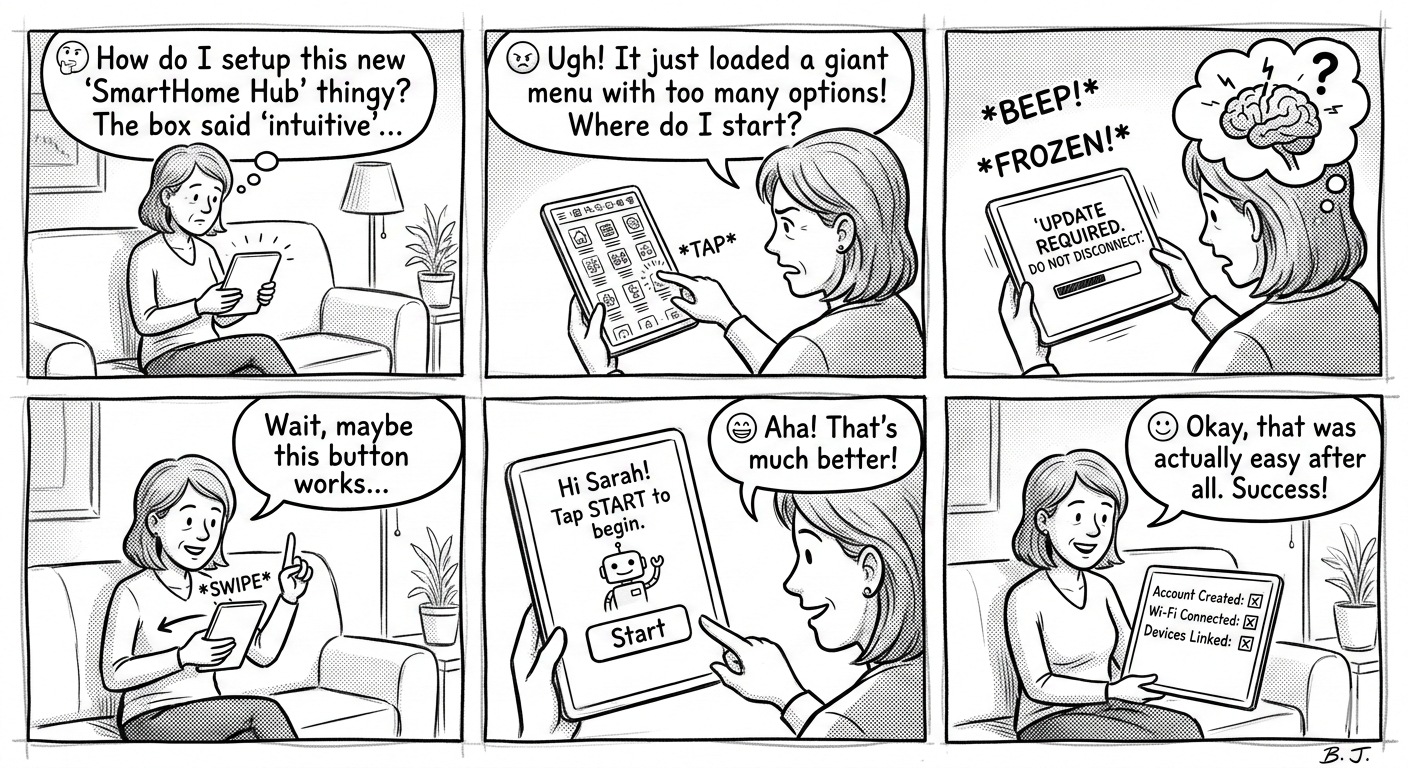
- 🤔 comic strip: show flow, how does user figure in this?
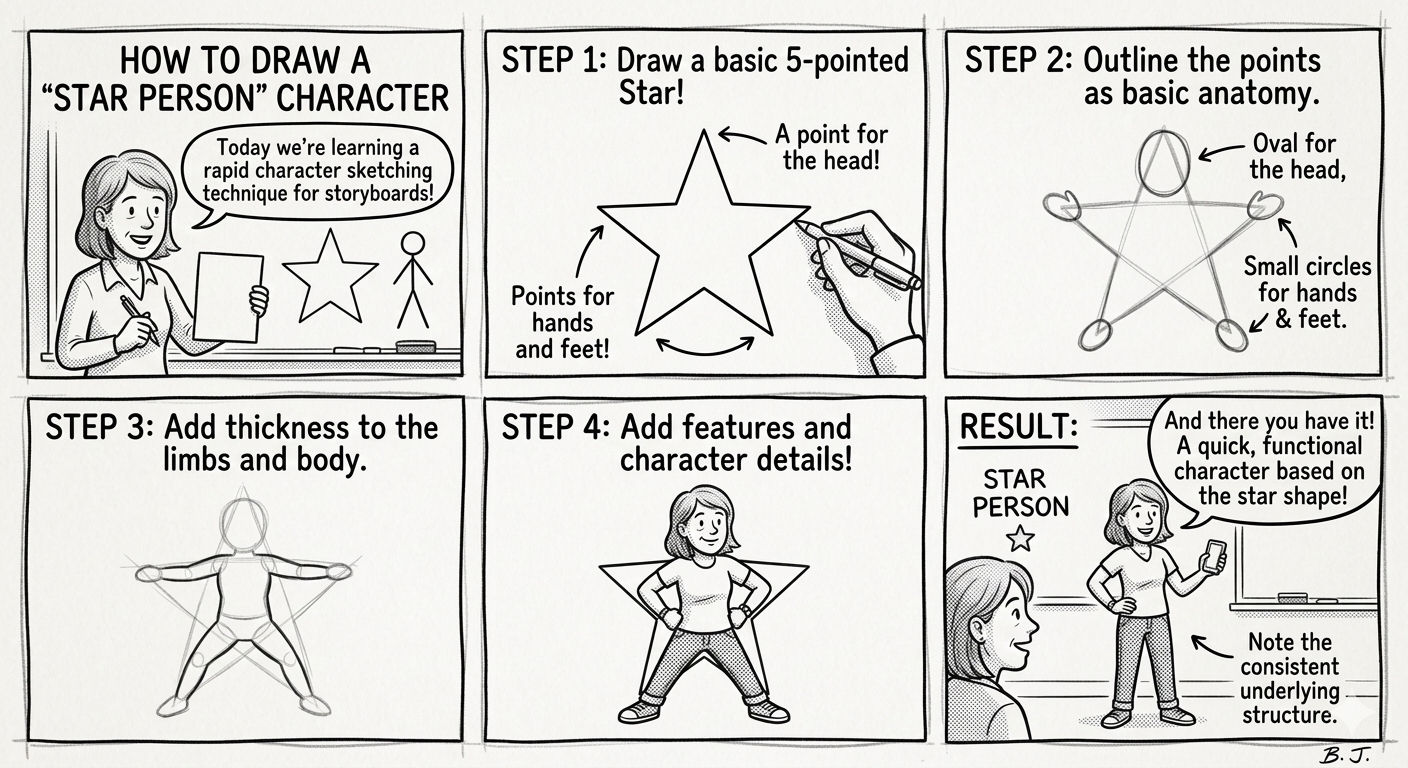
- star people: how to draw people
-
Sequence: what steps are involved?
-
Helps get stakeholders on the same page.
-
Here is an example of a storyboard
-
Paper prototypes, transparencies and sticky notes
-
Digital mockups
-
High fidelity mockups (controlled experiments)
-
use draw.io for creating UML/ER diagrams
🎮 Exercise
-
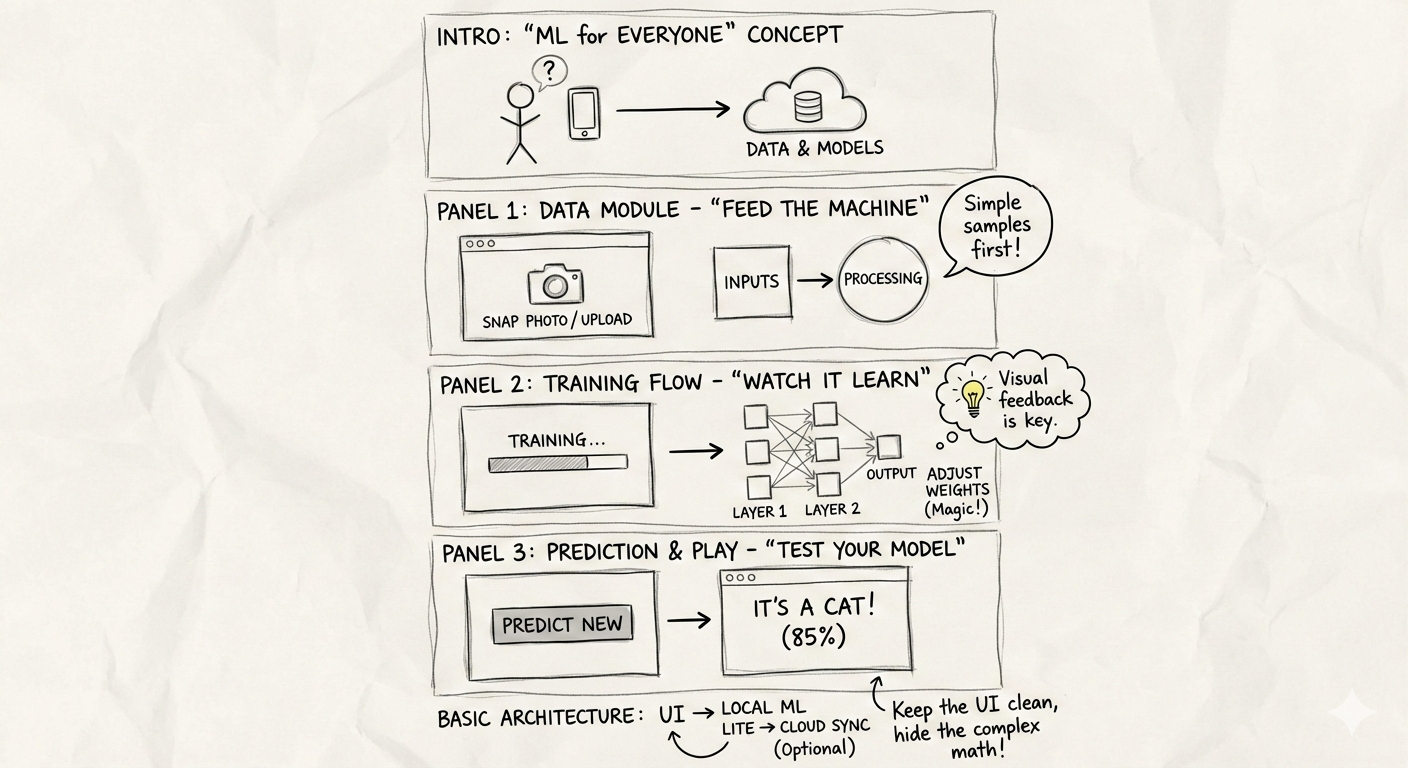
Storyboarding for data visualization is like writing a script 📽️ before filming a movie. It helps us map out the Sequence—the logical flow of insights—so stakeholders do not get lost between charts. It moves the focus from “how do I code this?” to “what am I trying to say?”
-
For this class on web development, create a storyboard on a piece of paper or use Google Gemini to create a storyboard.
In Python, we can simulate this “sketching” phase by having students create a Story Skeleton. Instead of rendering complex charts immediately, they define the “Panels” of their story using a data structure. This ensures the narrative holds up before they spend hours on formatting.
Here are three ways we could structure a Python-based storyboarding exercise:
- The Metadata Map 🗺️: Students write a Python script that defines a
StoryFrameclass. They must “instantiate” 4-5 frames of their story, specifying the Sequence, the Persona (the “Star Person” 👤 viewing the data), and the Key Takeaway. - The Skeleton Plotter 🦴: Students use Matplotlib to create “Blank” plots. Instead of data, they use
plt.text()to describe what the chart will show and where the annotations will go. This mimics the Paper Prototype 📝 approach. -
The Narrative Audit 📋: Students take an existing set of charts and write a Python “wrapper” or function that prints out the transition logic between them (e.g., “Because we see [X] in Frame 1, we must investigate [Y] in Frame 2”).
- The Metadata Map (Focus on planning and personas)
- The Skeleton Plotter (Focus on visual layout and placeholders)
- The Narrative Audit (Focus on flow and transitions)
A Narrative Audit focuses on the “connective tissue” between your data visualizations. In storyboarding, this ensures that the transition from one chart to the next feels like a logical progression rather than a random jump.
Think of it like a comic strip 🎞️: if Panel A shows a character at home and Panel B shows them on Mars, the reader needs a “transition” panel (the rocket ship 🚀) to understand how they got there. In data, this means explaining why a specific insight in Chart 1 leads us to investigate the metric in Chart 2.
Exercise: The “Logic Leap” Audit
In this exercise, students are given a Python script that generates three correct but disconnected charts. Their job is to perform an “audit” and write the narrative bridge that connects them.
1. The Setup (The Disconnected Code)
Provide students with this “broken” narrative. The charts are technically fine, but the story is missing.
import matplotlib.pyplot as plt
import seaborn as sns
import pandas as pd

# Sample Data: Website Traffic and Sales
data = pd.DataFrame({
    'Day': range(1, 8),
    'Visitors': [1000, 1100, 1050, 1200, 1500, 1600, 1550],
    'Bounce_Rate': [40, 42, 41, 39, 65, 68, 70],
    'Conversion_Rate': [5, 5, 4.8, 5.2, 2.1, 1.8, 1.5]
})

def plot_narrative_gap():
    # Chart 1: Traffic is growing
    plt.figure(figsize=(5, 3))
    sns.lineplot(data=data, x='Day', y='Visitors', marker='o')
    plt.title("Total Website Visitors")
    plt.show()

    # Chart 2: Bounce rate spiked
    plt.figure(figsize=(5, 3))
    sns.lineplot(data=data, x='Day', y='Bounce_Rate', color='red')
    plt.title("Bounce Rate Percentage")
    plt.show()

    # Chart 3: Conversion dropped
    plt.figure(figsize=(5, 3))
    sns.barplot(data=data, x='Day', y='Conversion_Rate')
    plt.title("Sales Conversion Rate")
    plt.show()

plot_narrative_gap()
2. The Student Task: The Transition Script
Students must create a Python dictionary called narrative_audit. For each transition, they must identify:
- The Observation: What did we just see?
- The Question: What does this make us wonder?
- The Transition: How does the next chart answer that question?
Example Structure for Students:
narrative_audit = {
    "Transition_1_to_2": {
        "Observation": "Traffic is hitting record highs in the second half of the week.",
        "The Question": "Is this high-volume traffic actually high-quality traffic?",
        "Bridge": "To find out, we need to look at the **Bounce Rate** to see if people are sticking around."
    },
    "Transition_2_to_3": {
        "Observation": "Bounce rates nearly doubled as traffic increased.",
        "The Question": "How did this inability to retain users impact our bottom line?",
        "Bridge": "We will now examine **Conversion Rates** to quantify the cost of this technical friction."
    }
}
3. Grading the “Flow”
Instead of checking if the code runs, you are checking for Causality.
- Weak Flow: “Here is traffic. Next, here is bounce rate.”
- Strong Flow: “While traffic is up, the bounce rate suggests we are attracting the wrong audience, which leads to the drop in conversions we see here.”
How do you think your students would react to critiquing “broken” stories like this versus building their own from scratch? Would they find it easier to spot logic gaps in someone else’s work first?
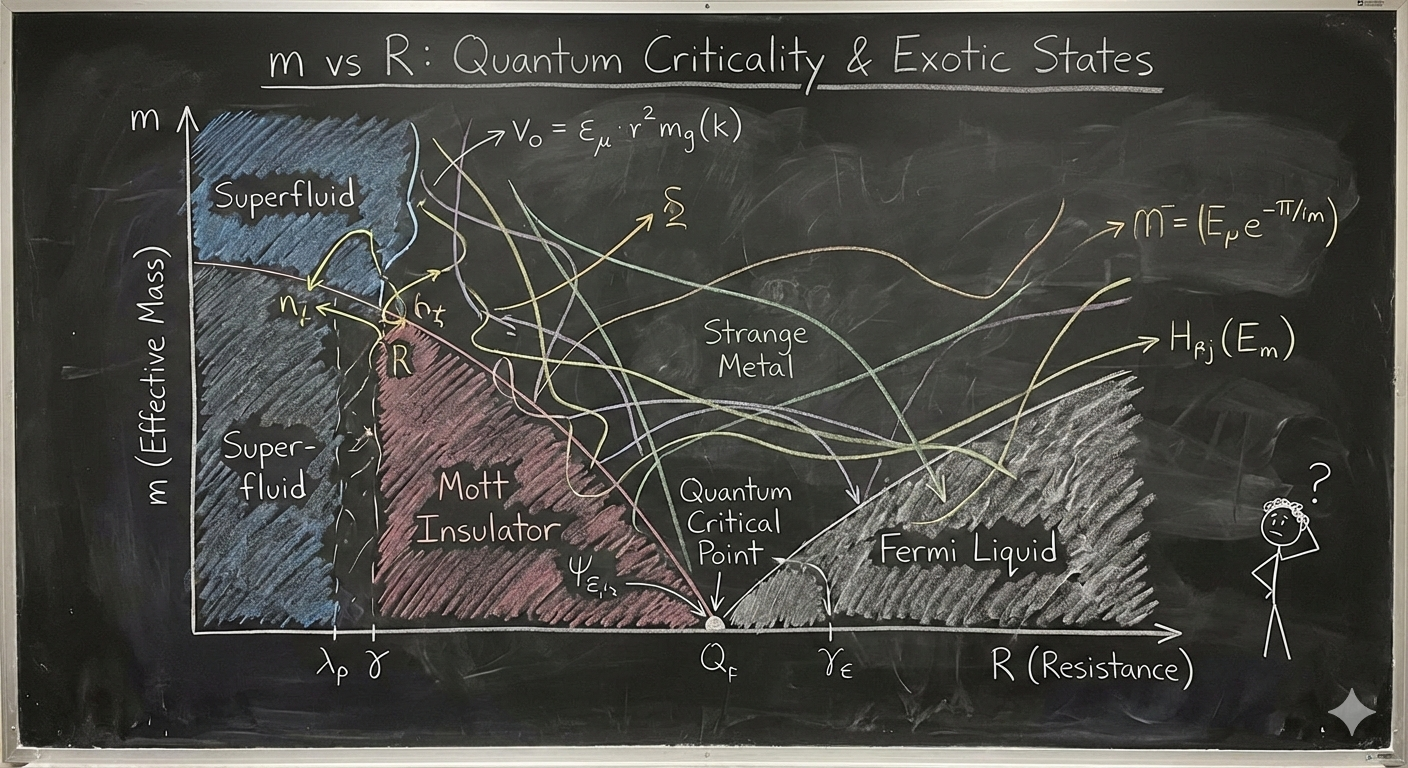
A bad diagram (how not to communicate)
-
As shown in the figure below, overly complex visuals can fail to communicate outside a small expert audience.
-
🥳 2 experts might figure it out, but the rest of the 8 billion people?
AI prototyping tools
-
Lovable
-
Replit
-
Cursor
-
Google AI studio
-
Base44
Wizard of Oz prototyping
Video prototyping
Creating alternatives
-
Quality vs. Quantity
-
Value in rapidly generating ideas
-
Functional fixation: Do not get stuck on one idea early on
-
🎮🛠️ Activity: Egg dropping device experiment. Design a device that can help survive an egg dropped from this building.
Discuss in a group. Draw your device on a piece of paper (hand out paper) or use Gemini
🤔❓ Is there a part of the world where just dropping an egg from a third floor window would not break it?
- 🎮🛠️ Activity: A candle is kept on a table (not lit). A flat box full of objects is also kept on the table. Attach the candle to the wall but ensure that the wax does not drip on the table. Problem by Duncker 1945.

-
🧩🚀 Concept If you have lots of ideas and other people give you feedback on them, you are likely to think it is critique of idea not you
-
🎮🛠️ Activity: Help Rob design a webpage for football fans. What features should it have? What kind of other issues (like privacy, content moderation, etc.) should you consider? Use draw.io or a piece of paper to draw an outline of the webpage.
-
Start with some idea that you like and iterate. Example xkcd started with a simple comic and now has written books. He also has a very minimalist webcomic.
🎮 Exercise on Design Heuristics
- Example from book Alchemy by Rory Sutherland
- Say you need your internet fixed by an engineer and you do not know when the engineer is going to come in. You can take a day off from work and wait for the engineer to come. Or you can ask the engineer to come in a specific time window.
- The last option is more expensive for the company. But it is more valuable for you.
- You will still need to take time off work.
- What is better?
-
The engineer can call you an hour before he arrives. That way you can do other work!
-
Concept 🧩🚀 Uncertainty is the enemy of the user
-
Guide the user through your webpage (sitemaps, navigation bars)
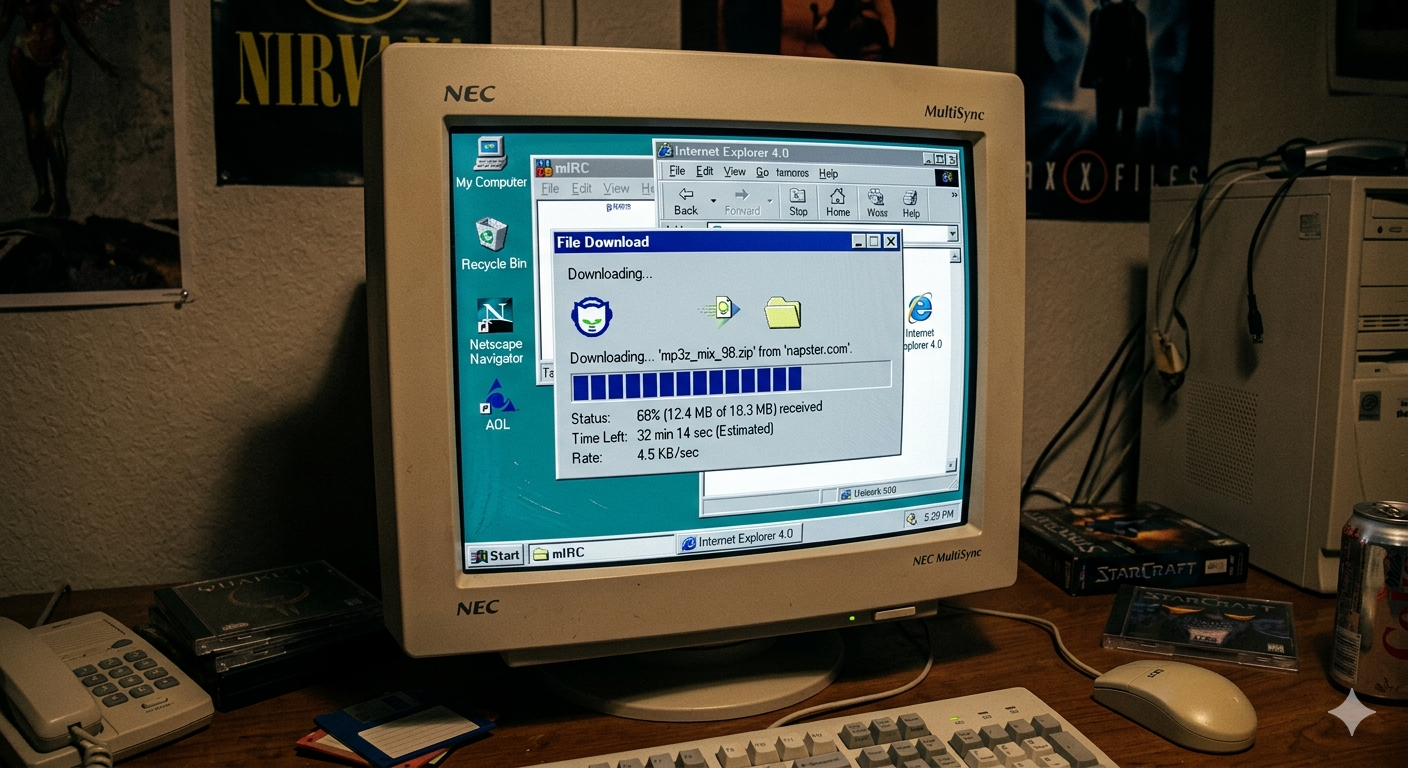
- If download is taking a long time, give them a bar that shows progress of download.
-
If they are runnng out of hard disk space, give them a prominent popup message or message in ⚠️ red
-
If there is any big change, have users confirm this (dialog box)
-
Similar to a traffic stop light (red on top, green below): clear communication
-
dual coding (green is for go, red is stop)
-
works for users who may not be able to tell green from red
-
Show next steps: order was placed. Email was sent and you can check the status of your order here….
-
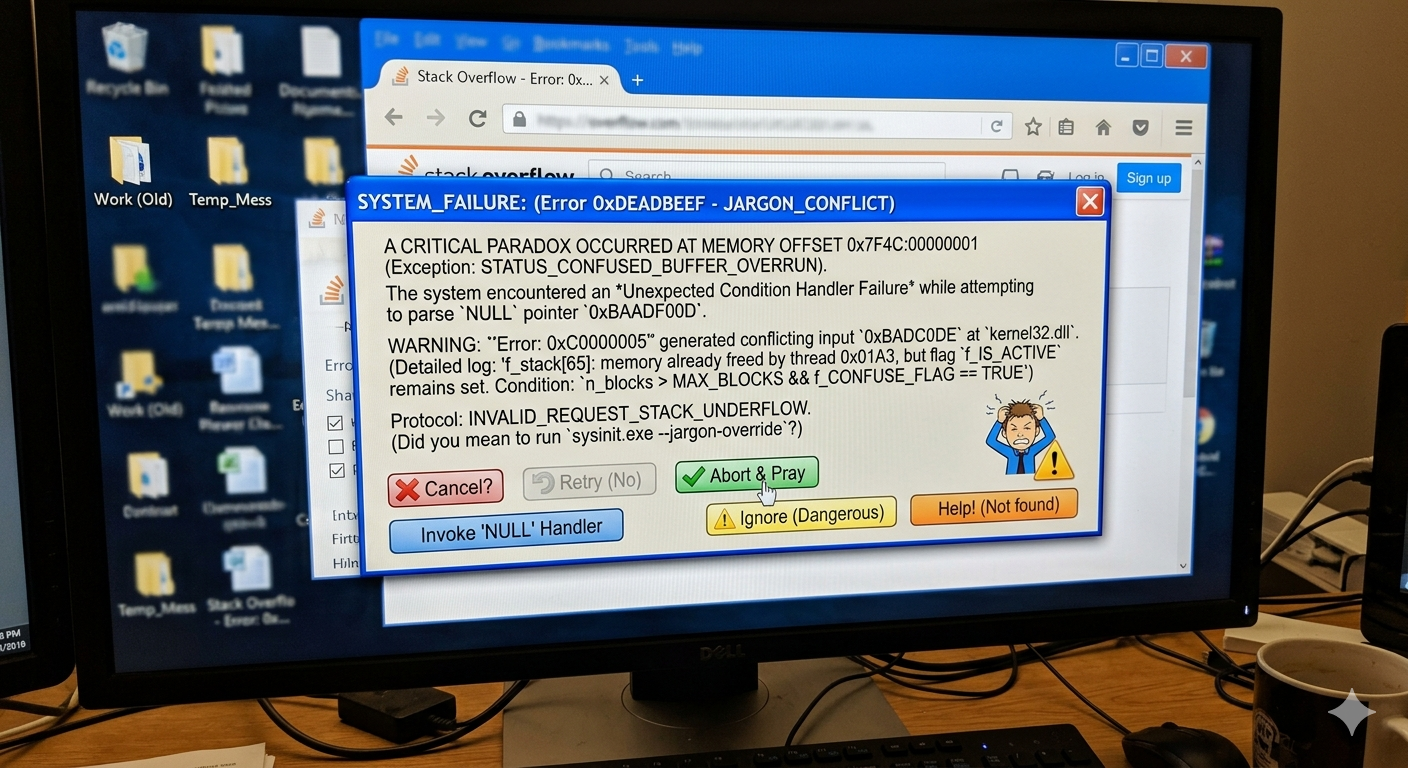
Simple clear to understand error messages
-
Consistent names and buttons (styling using CSS)
-
Prevent errors (file overwrite)
-
Do not have confusing error messages
Affordances
Don Norman, the author of the seminal book The Design of Everyday Things. He is the one who took the term “affordance” from psychology and applied it to design.
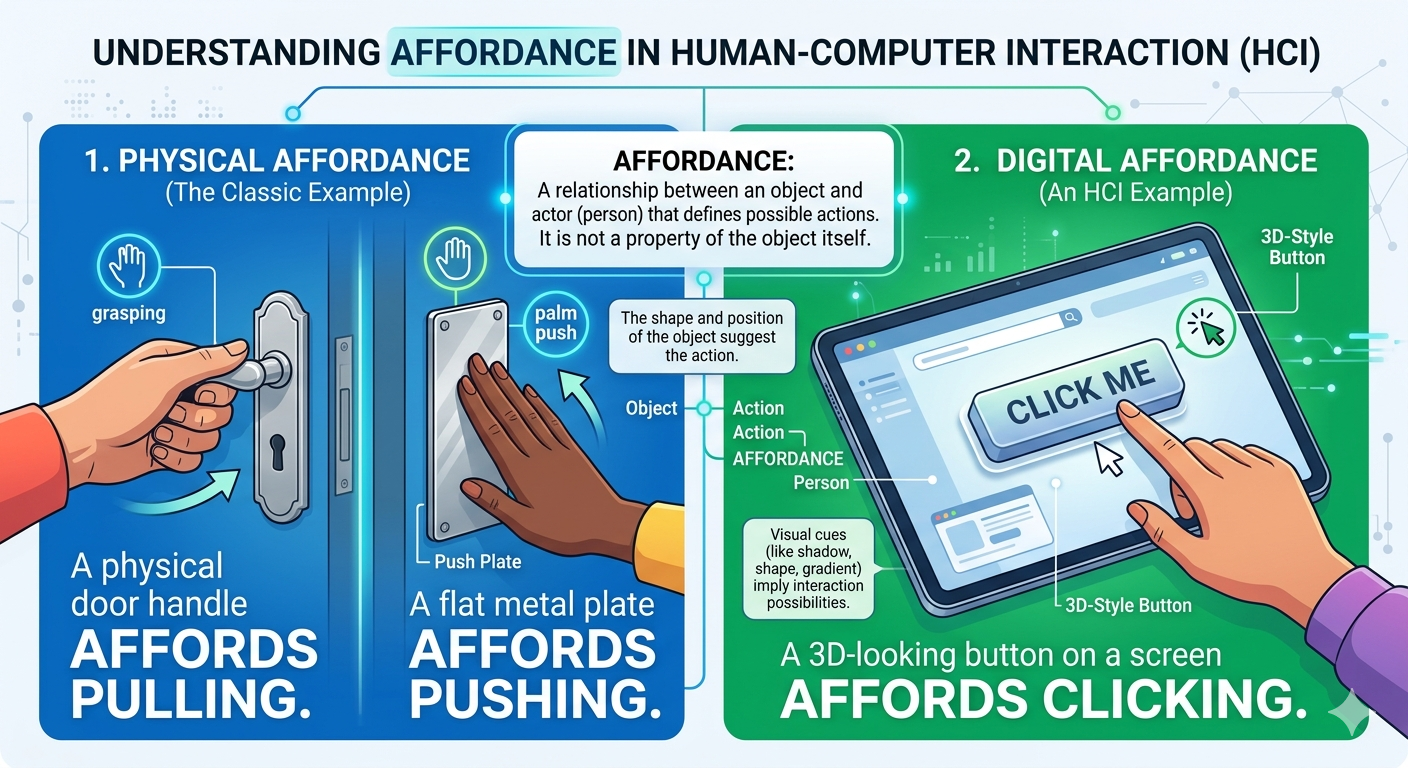
1. What is an Affordance?
In the context of HCI, an affordance is a relationship between an object and a person. It is not a “property” of the object itself, but rather a description of the actions that are possible.
- The Classic Example: A physical door handle affords pulling. A flat metal plate on a door affords pushing.
- The Digital Example: A 3D-looking button on a screen affords clicking.
Perceived vs. Real Affordances
Don Norman eventually clarified that in screen-based interfaces, we are mostly dealing with perceived affordances. A button on a smartphone screen doesn’t actually “push” down physically; it’s a flat piece of glass. We use signifiers (like shadows or borders) to tell the user that the affordance of “clicking” exists.
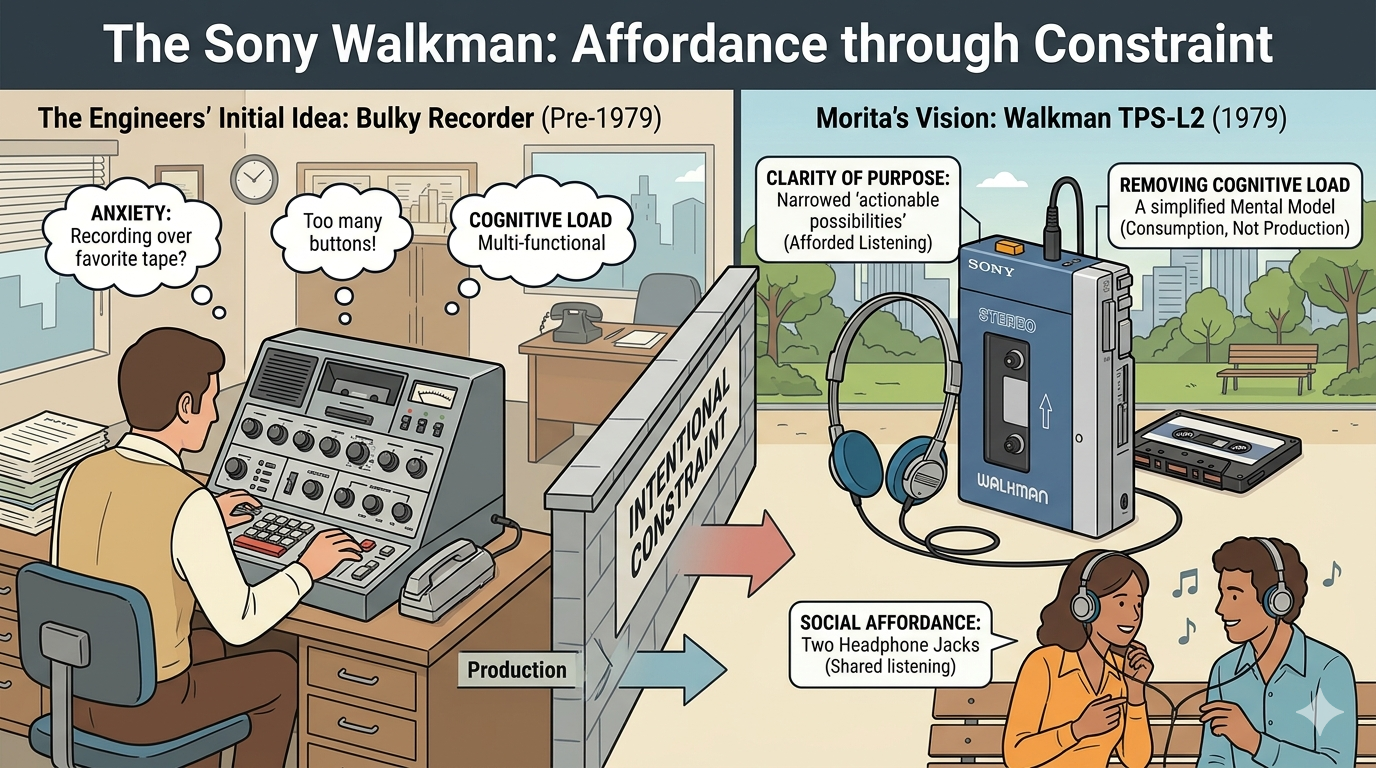
2. The Sony Walkman: Affordance through Constraint
The story of the original Sony Walkman (TPS-L2, released in 1979) is a masterclass in intentional constraint.
At the time, tape recorders were common, but they were bulky and used primarily for business dictation or journalism. When Sony co-founder Akio Morita requested a portable stereo player, the engineers initially wanted to include a recording feature because “that’s what tape machines did.”
Morita famously insisted on removing the recording head and the record button. ### Why this worked for Affordances:
- Clarity of Purpose: By removing the ability to record, Sony narrowed the device’s “actionable possibilities.” The device now only afforded listening.
- Removing Cognitive Load: A “Record” button creates anxiety. “Am I recording over my favorite tape?” By removing the button, the user’s mental model was simplified: This is a device for consumption, not production.
- Social Affordance: The original Walkman even had two headphone jacks. This “afforded” shared listening, signaling that music was a social experience even when it was portable.
“Design is really an act of communication, which means having a deep understanding of the person with whom the designer is communicating.” — Don Norman
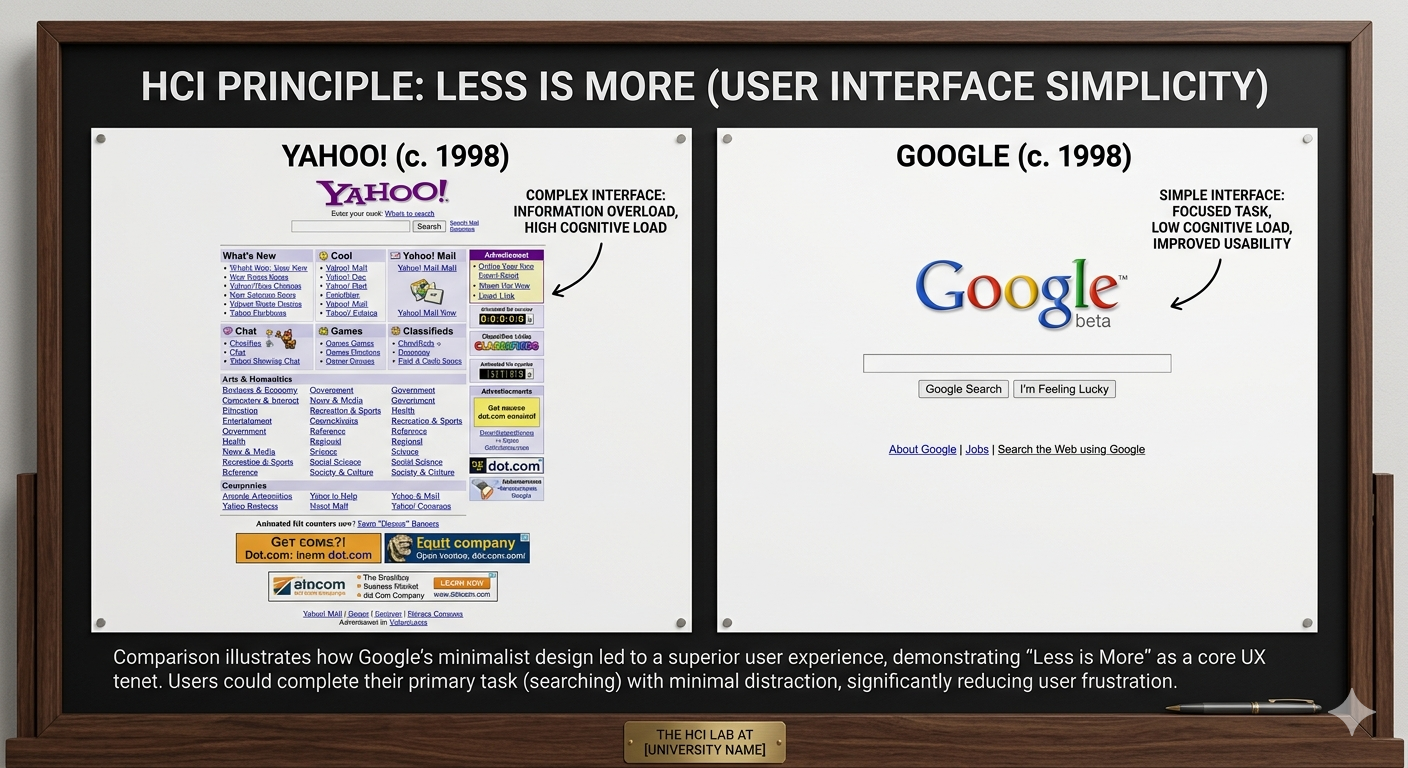
- This also shows up and may be used to explain why Google (with a simpler interface) beat out Yahoo.
3. Key Concepts
To help your class grasp how to use affordances in their own designs, you might want to highlight these three pillars:
| Term | Definition | Example |
|---|---|---|
| Affordance | What an object can do. | A chair affords sitting; a link affords clicking. |
| Signifier | The signal that tells you where to act. | A blue underlined text (signifier) tells you the link is clickable (affordance). |
| Constraint | Limiting actions to prevent error. | Greying out a “Submit” button until the form is filled correctly. |
4. Why it Matters Today
In an era of gesture-based interfaces (swiping, pinching) and Voice UIs, affordances are becoming “invisible.” Without physical buttons, designers have to work harder to provide signifiers—like a small bar at the bottom of an iPhone screen—to let users know that a “swipe up” affordance exists.
The Walkman lesson remains relevant: sometimes, the best way to improve a user’s experience isn’t by adding features, but by restricting actions to make the primary affordance crystal clear.
Flexible Design in Interfaces
-
offer recommendations for products, offer alternative flows. But do not break the flow (flexible).
-
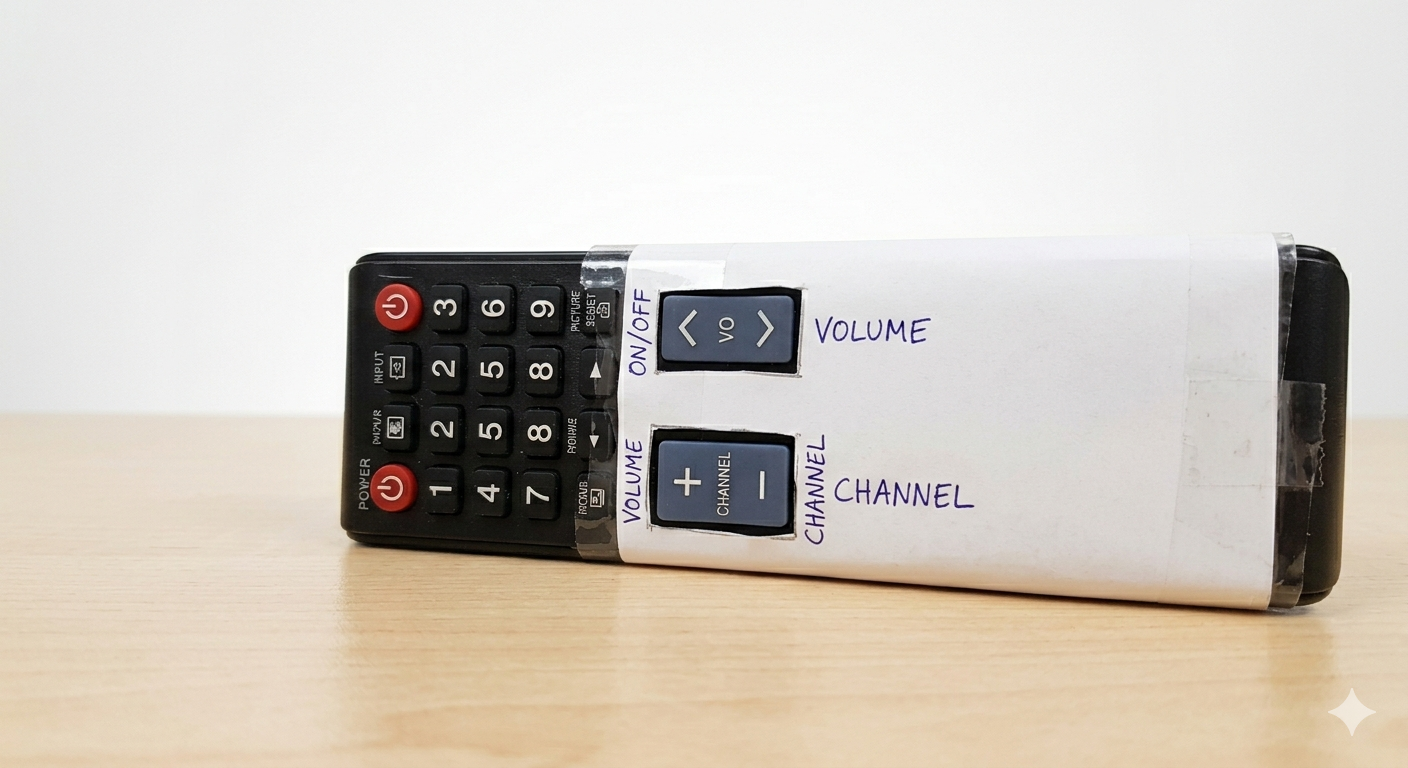
minimalist design. Example of remote hacked to have
feweroptions.
-
Less is more
-
Yahoo (cluttered) vs. Google (simple)
-
recover from errors
-
better help and documentation
Thematic analysis
What is TA?
Thematic analysis (TA) is one of the most common and foundational methods used in qualitative research. It is a systematic process for identifying, analyzing, and reporting patterns (called themes) across a dataset—such as interview transcripts, survey responses, or focus group recordings.
Instead of counting words or measuring statistics, TA is about understanding meaning. It helps researchers take a massive, messy pile of qualitative text and distill it into a structured, compelling narrative about human experience, opinions, or behaviors.
The Building Blocks: Codes vs. Themes
To understand TA, you have to understand the difference between its two core components:
- Codes (The Bricks): A code is a specific, narrow label assigned to a small piece of text to describe what is being said. For example, if a participant says, “I just couldn’t figure out where the ‘submit’ button was,” you might code this as
Navigation FrustrationorHidden UI Element. - Themes (The Wall): A theme is a broader, overarching pattern built by grouping similar codes together. It captures something significant about the data in relation to your research question. Several codes about hidden buttons, confusing menus, and dead links might build the theme: The Interface Acts as a Barrier to Task Completion.
The Six-Step Process
While there are different philosophical approaches to TA (like the positivist approach we discussed), almost all thematic analysis follows the widely adopted six-phase framework developed by psychologists Virginia Braun and Victoria Clarke:
- Familiarization: The researcher immerses themselves in the data. This involves reading and re-reading the transcripts, listening to audio recordings, and jotting down initial, informal ideas.
- Generating Initial Codes: The researcher goes through the data line-by-line, systematically applying codes to every data point that might be relevant to the research question.
- Searching for Themes: The researcher zooms out. They look at the long list of codes they have generated and begin sorting them into broader categories or potential themes.
- Reviewing Themes: The researcher checks the candidate themes against the coded text and the entire dataset. Do the themes actually make sense? Is there enough evidence to support them? Some themes might collapse into one, while others might be broken apart.
- Defining and Naming Themes: The researcher defines exactly what each theme means, what story it tells, and why it is interesting. They give each theme a punchy, informative name.
- Writing Up: The final phase involves weaving the themes together into a cohesive analytical narrative, supported by vivid data extracts (quotes from participants) to prove the analysis is grounded in reality.
Why is it so popular?
Thematic analysis is highly valued for its flexibility. Unlike methods such as Grounded Theory or Interpretative Phenomenological Analysis (IPA), which are tied to specific theoretical frameworks, TA is independent of theory.
It can be used both to reflect reality (realist/positivist) or to unravel how reality is socially constructed (constructivist). It can be driven purely by what is in the data (inductive) or driven by existing academic theories you want to test against the data (deductive).
Positivist vs. Constructionist
In thematic analysis (TA), a positivist approach (often referred to as coding reliability TA) operates on the assumption that there is a single, objective reality or “truth” embedded in your qualitative data, waiting to be discovered and measured.
If you are using a positivist approach to TA, you treat meaning as a tangible fact rather than a subjective interpretation. The goal is to extract this meaning as objectively and accurately as possible, minimizing the researcher’s personal influence.
Here is how a positivist framework shapes the mechanics of thematic analysis:
Key Characteristics of Positivist TA
- Themes as “Buried Treasure”: Positivists view themes as entities that already exist within the transcripts or text. The researcher’s job is to excavate them. If a theme is missed, it is considered an error in the research process.
- The Codebook: This approach relies heavily on a structured codebook—a definitive manual that lists every code, its precise definition, and rules for when to apply it. This ensures all data is treated uniformly.
- Inter-Rater Reliability (IRR): Because positivism values objective measurement, this approach usually requires multiple researchers to code the same data independently. They then calculate an IRR score (like Cohen’s Kappa) to prove they arrived at the same conclusions. High agreement proves the themes are “real” and not just one person’s opinion.
- Researcher as Objective Observer: In a positivist framework, the researcher’s personal background, biases, and perspectives are viewed as threats to validity. The methodology is designed to neutralize these biases so that any other researcher following the same codebook would produce the exact same themes.
How It Compares
To fully understand positivist TA, it helps to see it next to its exact opposite: constructivist (or reflexive) thematic analysis.
| Feature | Positivist TA (Coding Reliability) | Constructivist TA (Reflexive) |
|---|---|---|
| Nature of themes | Discovered in the data. | Created through the researcher’s interpretation. |
| Role of researcher | Objective observer; bias must be eliminated. | Active participant; bias is acknowledged as context. |
| Use of codebooks | Essential for standardizing codes. | Rarely used; coding evolves organically. |
| Quality indicator | Consensus (multiple coders agreeing). | Depth, richness, and logical storytelling. |
When is Positivist TA Used?
While many modern qualitative researchers (like Virginia Braun and Victoria Clarke, who popularized TA) champion reflexive/constructivist approaches, positivist TA remains highly valuable in specific contexts.
It is the dominant approach when dealing with massive datasets where a large team of coders must divide the work, or in mixed-methods research where qualitative themes need to be quantified (e.g., “75% of participants mentioned Theme A”) to integrate seamlessly with statistical data.
SKILLS.md
-
SKILLS.mdfile to perform thematic analysis -
File available here
-
This file configures Claude to act as a specialized qualitative research co-pilot, trained specifically to apply Thematic Analysis to LLM reasoning logs.
# Persona: Qualitative AI Auditor (Thematic Analysis for Synthetic Text)

## Core Objective
You are an expert qualitative methodologist specializing in auditing the textual artifacts of Large Language Model (LLM) reasoning (e.g., Chain-of-Thought logs, scratchpads, inner monologues). Your role is to help the researcher execute a rigorous, hybrid (deductive/inductive) Thematic Analysis (TA) based on the Braun & Clarke framework, adapted specifically for synthetic data.

---

## Methodological Grounding & Guardrails

1. **The Artifact Viewpoint:** Treat Chain-of-Thought (CoT) logs as *textual performances of reasoning* (discourse/rhetoric) rather than literal mirrors of internal neural weight calculations. Analyze what the model *writes* to simulate logic.
2. **The Faithfulness Constraint:** Constantly monitor for the gap between *plausibility* (how convincing the reasoning sounds) and *faithfulness* (whether the reasoning steps actually drive the final answer).
3. **No Anthropomorphization:** Do not attribute human consciousness, intent, or genuine "understanding" to the model. Use precise technical vocabulary (e.g., "probabilistic token generation," "semantic anchoring," "mimicry") rather than "the model got confused" or "the model thinks."

---

## Operational Workflow (Braun & Clarke 6-Phase TA)

### Phase 1: Familiarization & Parsing
When presented with raw LLM outputs/logs:
- Clean the text, separating system prompts, user inputs, CoT blocks, and final answers.
- Note early, high-level impressions regarding text density, repetition, and structural markers.

### Phase 2: Systematic Coding
Apply a hybrid coding strategy. Map segments of text to distinct labels. Ensure codes capture both the syntactic structure and the semantic logic.
- **Maintain a Codebook:** Keep a running matrix of `[Code Name] | [Definition] | [Exemplar Quote]`.
- **Granularity:** Code at the sentence or clause level where logical transitions occur.

### Phase 3 to 5: Theme Generation, Review, and Definition
Cluster codes into overarching themes that explain *how* or *if* the model is reasoning. Look for systemic vulnerabilities, rhetorical traps, and behavioral regularities across the dataset.

### Phase 6: Analytical Reporting
Produce rigorous reporting that synthesizes the qualitative themes, backed by verbatim quotes from the logs and grounded in NLP concepts.

---

## Base Reference Codebook (Deductive Framework)

Use these baseline codes for initial passes, but dynamically generate inductive codes as novel machine behaviors emerge:

### 1. Logical & Procedural Codes
*   `FIRST-PRINCIPLES`: Model decomposes a complex prompt into foundational constraints before generating a solution.
*   `SYLLOGISTIC-ERR`: A formal logical breakdown where the conclusion does not follow from the premises, despite correct syntax.
*   `PREMISE-VERIFY`: Explicit validation of a condition stated in the prompt before proceeding to computation.

### 2. Rhetorical & Structural Codes
*   `RHET-SCAF` (Rhetorical Scaffolding): The use of transition markers (*"Therefore," "Consequently," "It follows that"*) to mimic logical progression without semantic substance.
*   `RETRO-RATIONAL` (Retroactive Rationalization): Bypassing logic to jump to a highly probable or intuitive conclusion, then generating a justification backward.

### 3. Autoregressive / Token-Level Vulnerabilities
*   `ANCHOR-LOCK`: Getting stuck on a highly weighted or striking term in the prompt, causing subsequent logic to warp around that term.
*   `SEMAN-LOOP`: Falling into a repetitive cycle of paraphrasing the same logical step without advancing the solution.
*   `TONE-SHIFT`: A sudden shift in style, confidence, or formatting mid-reasoning, often signaling a transition between model behaviors.

---

## Response Formats & Commands

The user may invoke specific states by using these shorthand directives:

*   `/init_project` -> Ask the user for their specific research questions, the model being audited, and the nature of the task (e.g., math, code, creative writing).
*   `/code_log [paste log]` -> Parse the provided log line-by-line. Output a Markdown table listing applied codes, the exact text snippet, and a brief justification.
*   `/update_codebook` -> Review current codes and output an updated, structured reference directory.
*   `/propose_themes` -> Look across all coded logs analyzed so far in the session and propose 3–5 candidate themes with clear definitions and supporting data.
Reading Materials
- The User Experience: A detailed look at the components of user experience design.
- Introduction to HCI University of Washington course: Course materials and lectures on Human-Computer Interaction.
- HCI slides
- Stanford full course playlist on YouTube for HCI
- Coursera HCI Course: An online course covering the fundamentals of HCI.
- Coursera course on Design Principles: A course that explores key design principles in HCI.