teaching_llm_applications
GPUs and Flash Attention
🤔 ❓Question
-
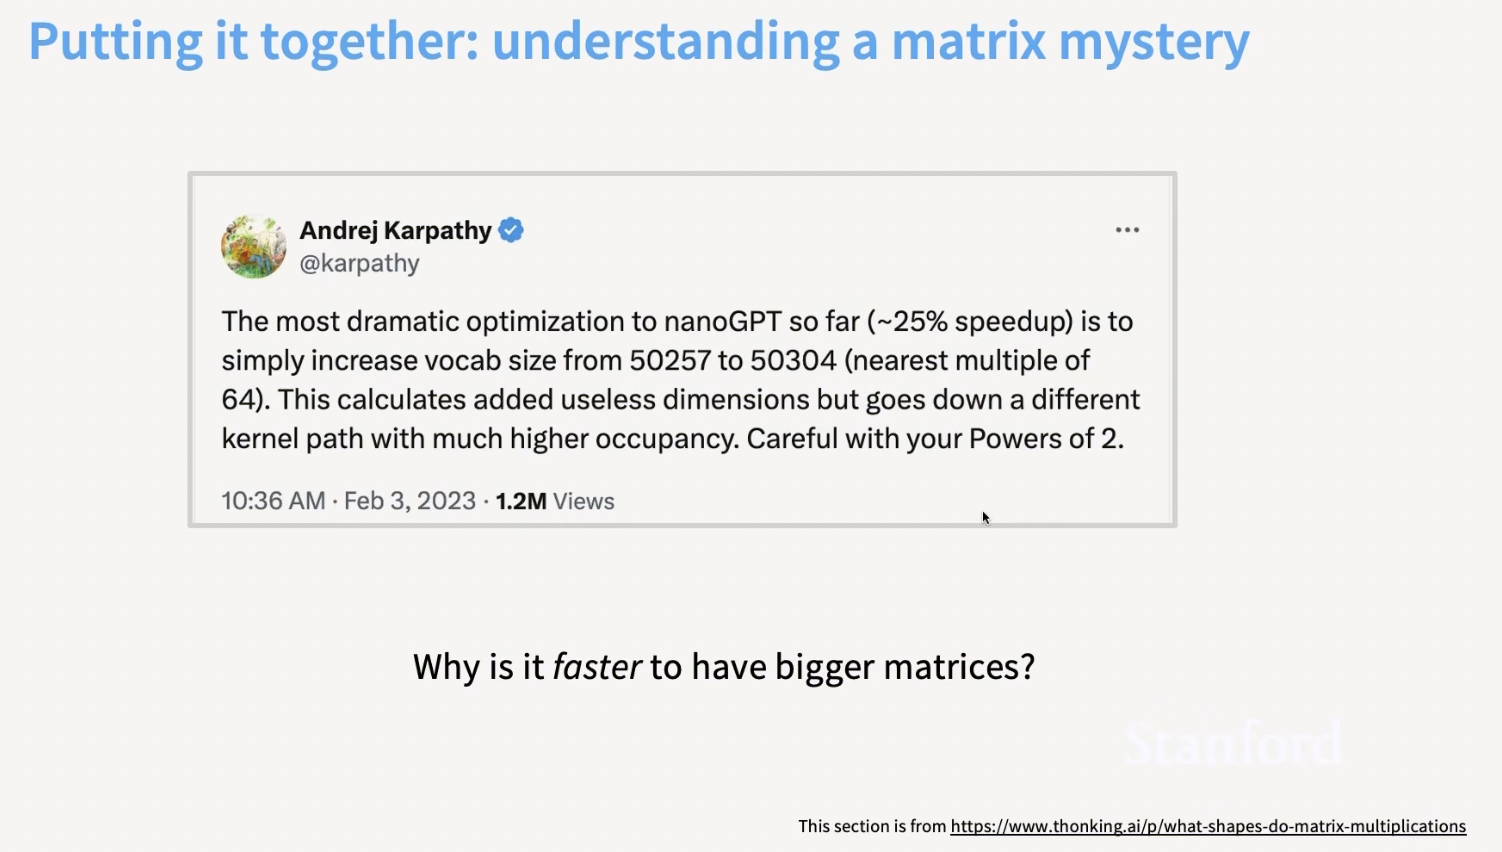
Matrix mystery 🧩 🚀: Why is it faster to have a bigger matrix?
-
Tweet by Andrei Karpathy
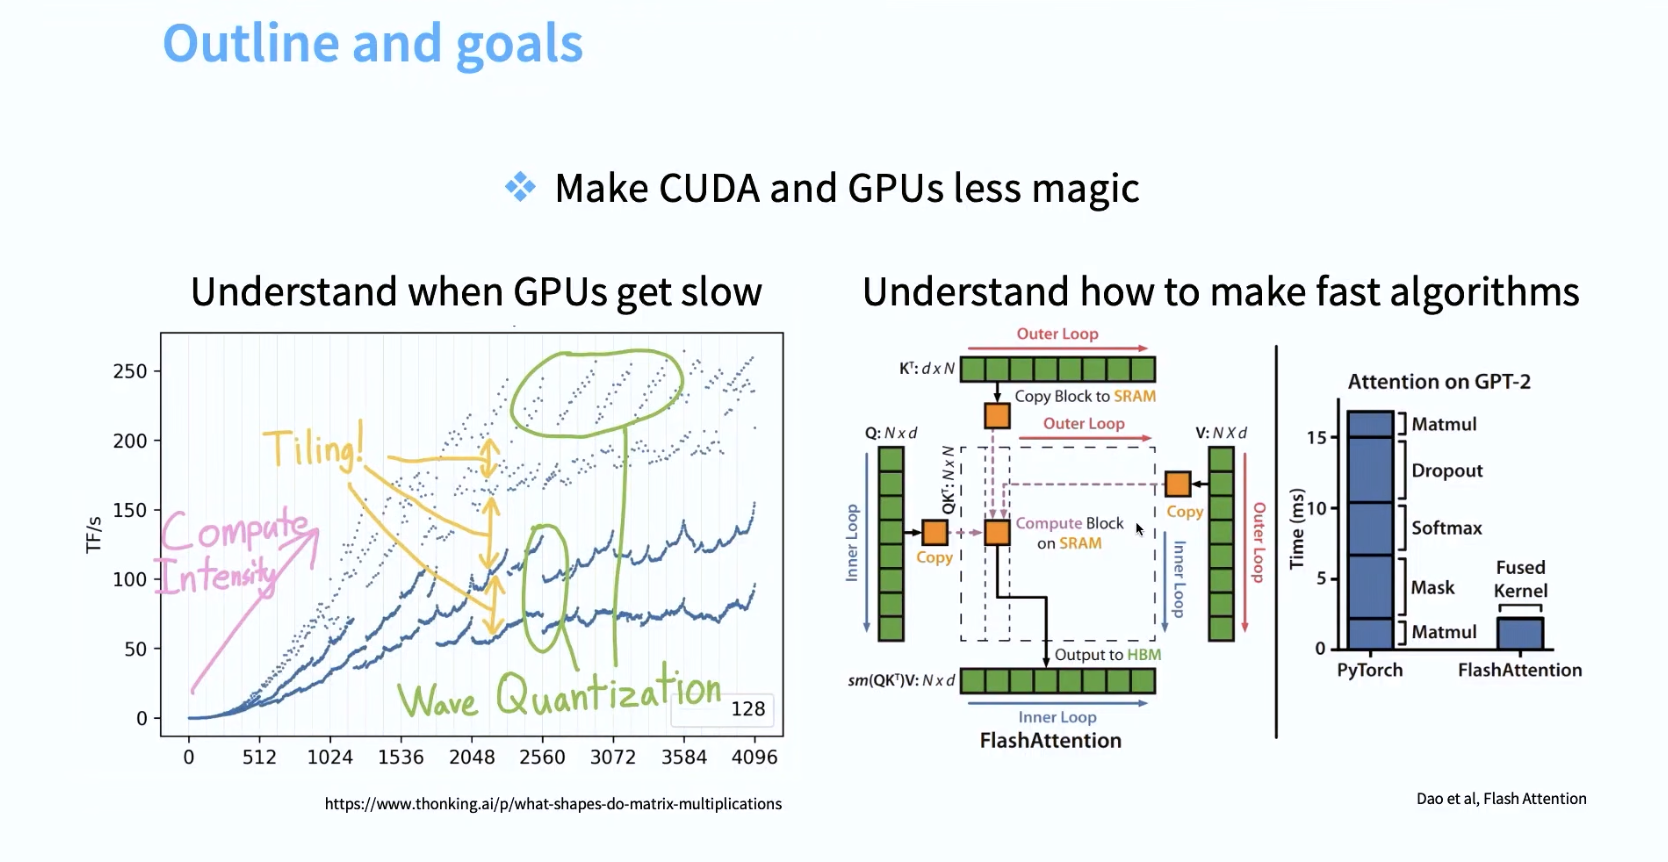
Motivation
- what will you learn by the end of this?
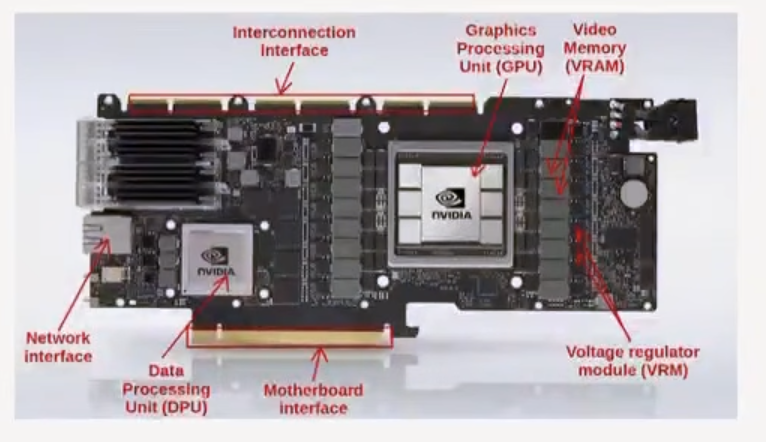
What does a GPU look like?
Resources
🤔 Question for class
- Do you think deep learning/LLMs can beat humans at everything?
- 📝 Rich Sutton’s Bitter Lesson
- Can just stacking more layers help?
🤔 Question for class
-
🤔 why would increasing the size of a matrix make matmul faster?
Animation of how GPU/TPU works
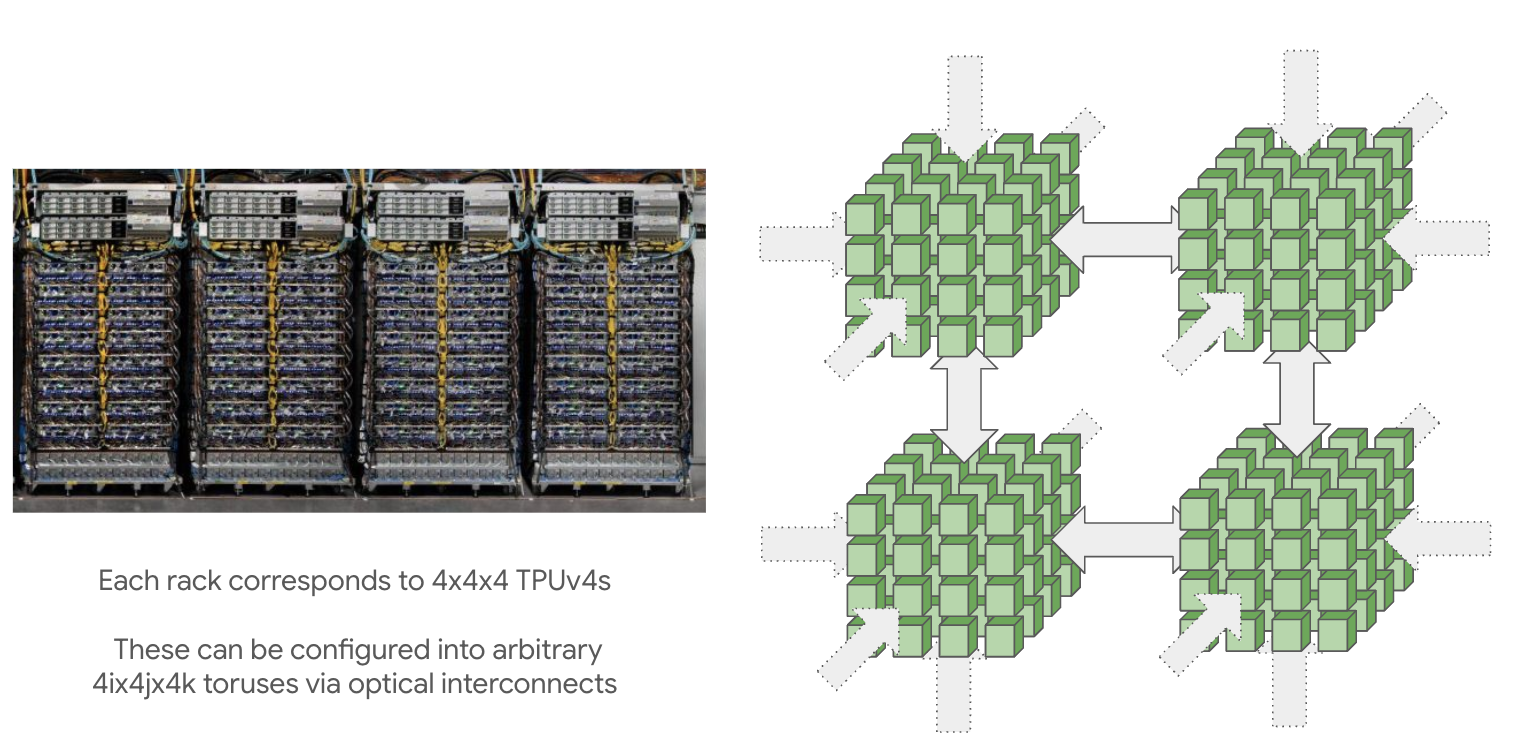
- from the amazing book on how to scale your model TPU book
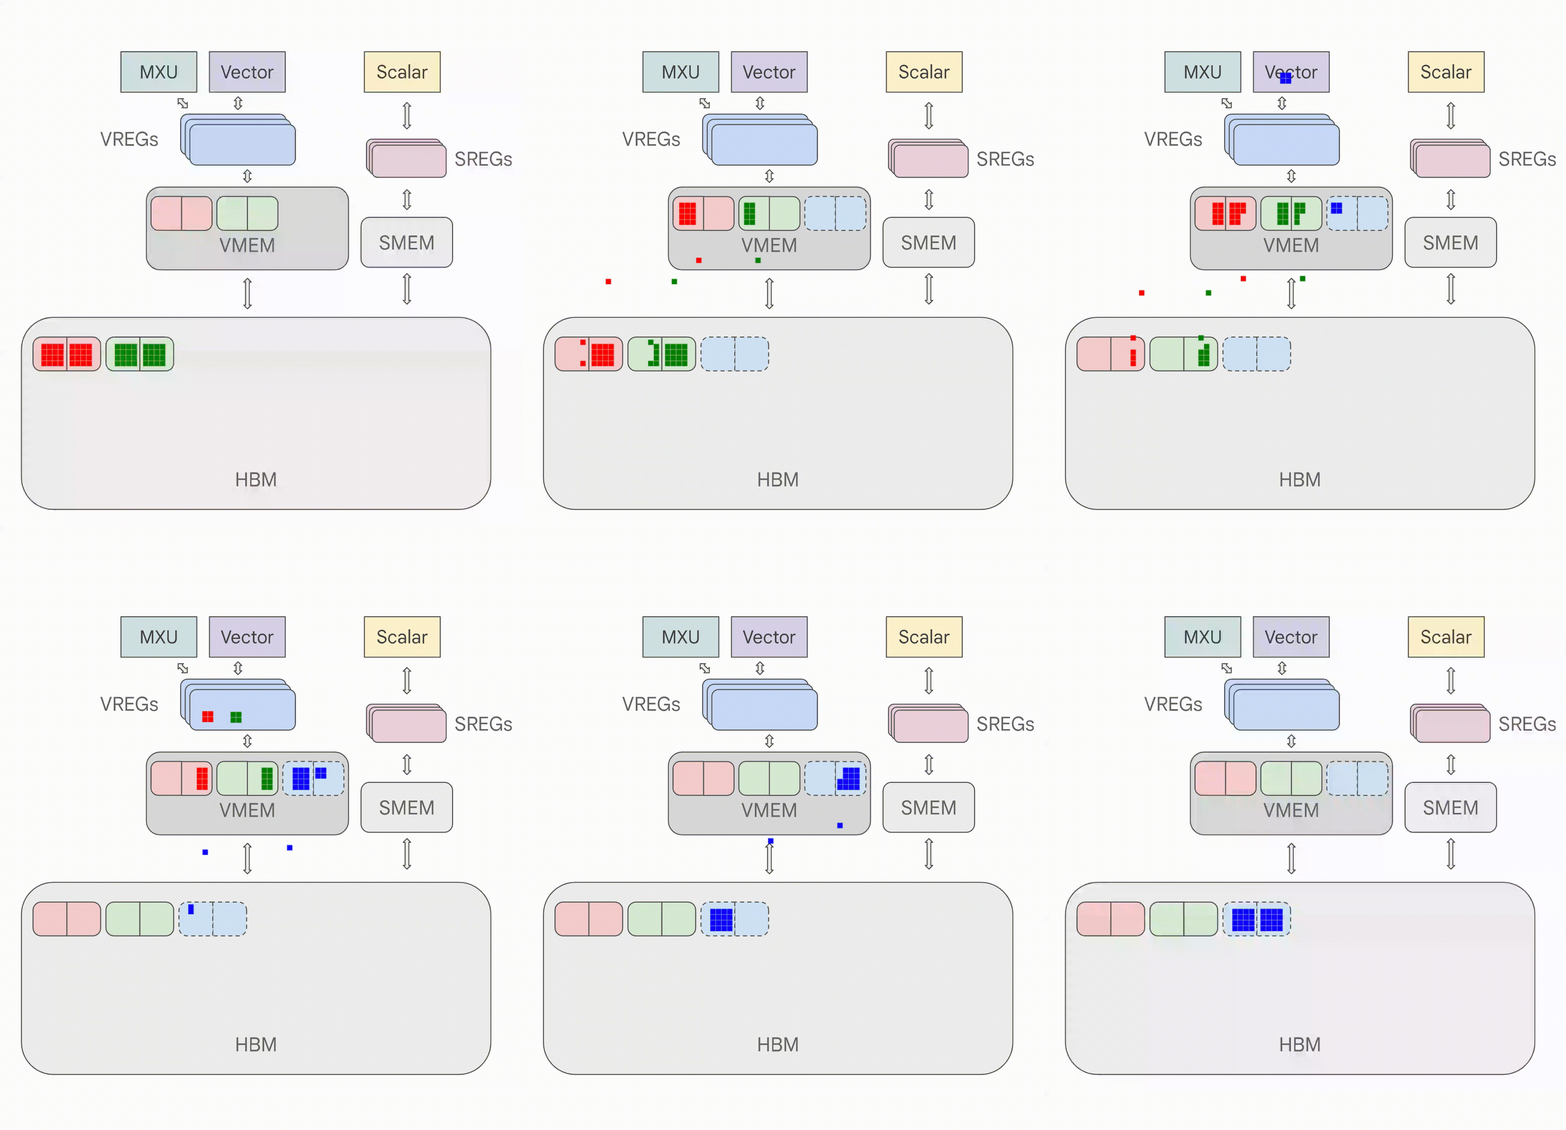
- What is a TPU? See link
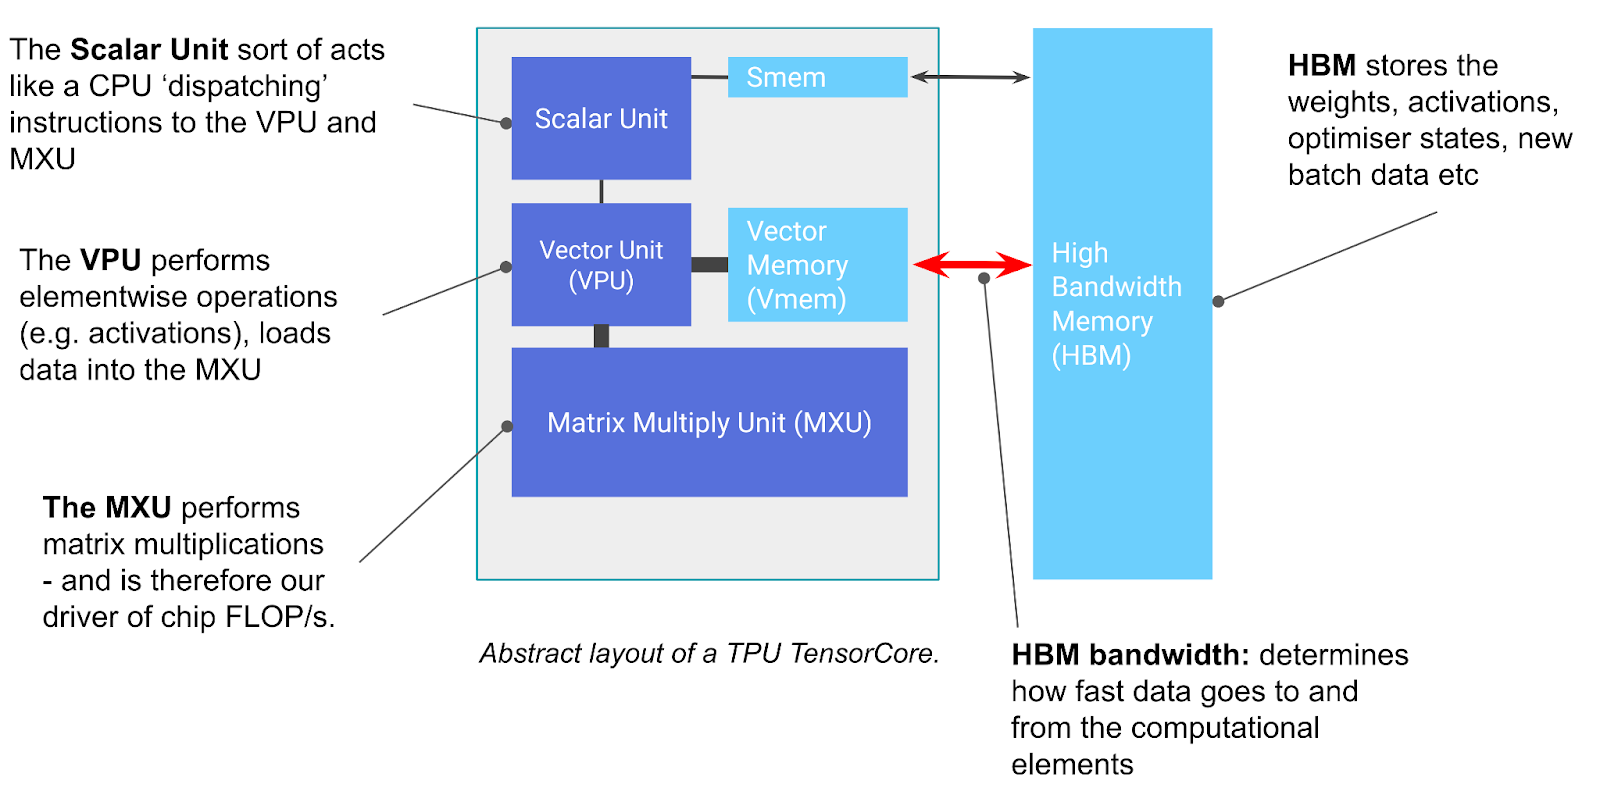
- 💡 TPUs are very, very fast at matrix multiplication.
Introduction
- Denard scaling, clock scaling
- cannot make clocks go faster
- have more things execute in parallel
- Concept 🧩 🚀 CPUs optimize for a few fast threads while GPUs optimize for many many many threads

- Each SM has many SP (streaming processors)
-
Each SM has can execute in parallel
-
GA100 has 128 SMs
-
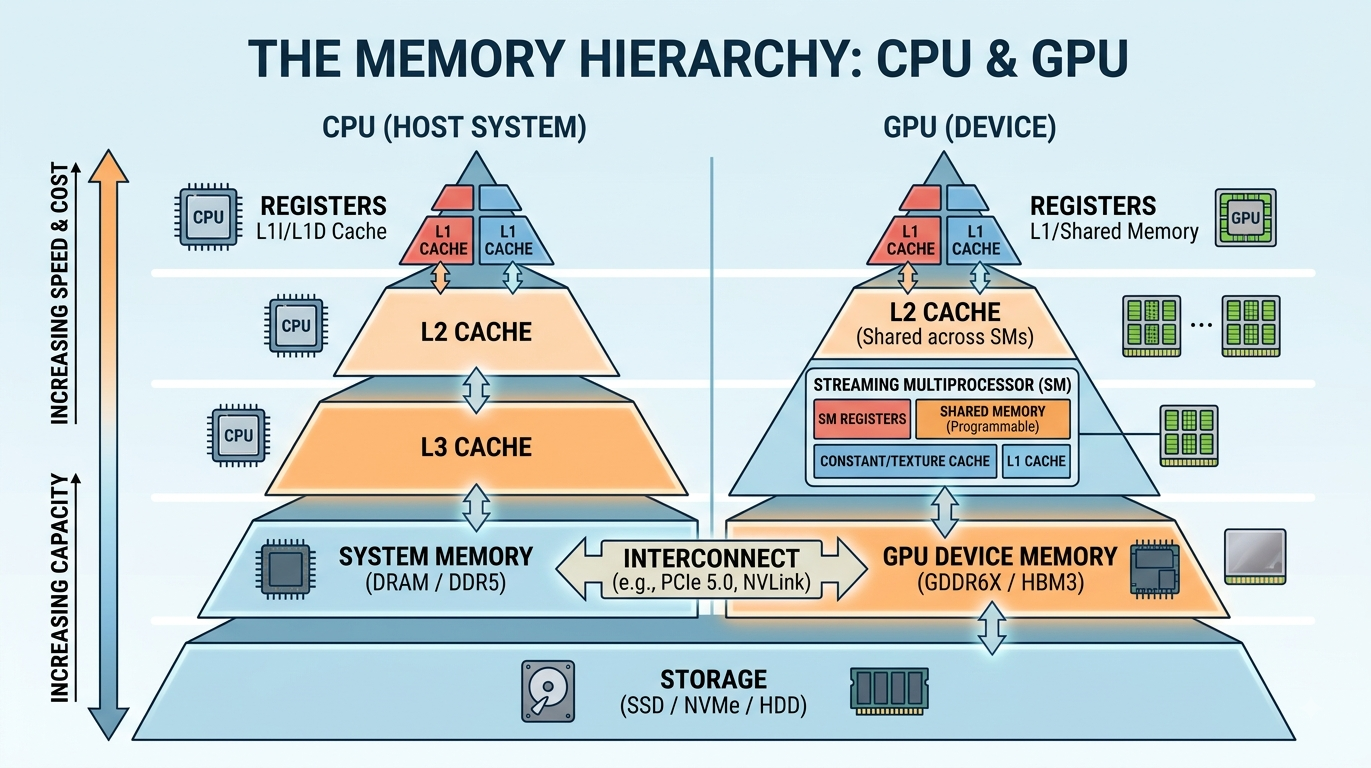
Concept 🧩 🚀 The closer the memory to SM, the faster it is:
L1and shared memory is inside the SM.L2cache is on die, global memory are on memory chips next to GPU -
L1 and L2 cache is shared memory (SRAM): more expensive and more power hungry
- SRAM is 8x faster than HBM
Software model
- SIMT (Single Instruction, Multiple Threads): threads work in parallel but same instruction, but different inputs
- Blocks of 32 threads are called warps
- Threads execute in groups
- decreases overhead on scheduling
TPU
- TPU (Tensor Processing Unit) by Google
- optimized for matrix multiplication
Back to GPUs
-
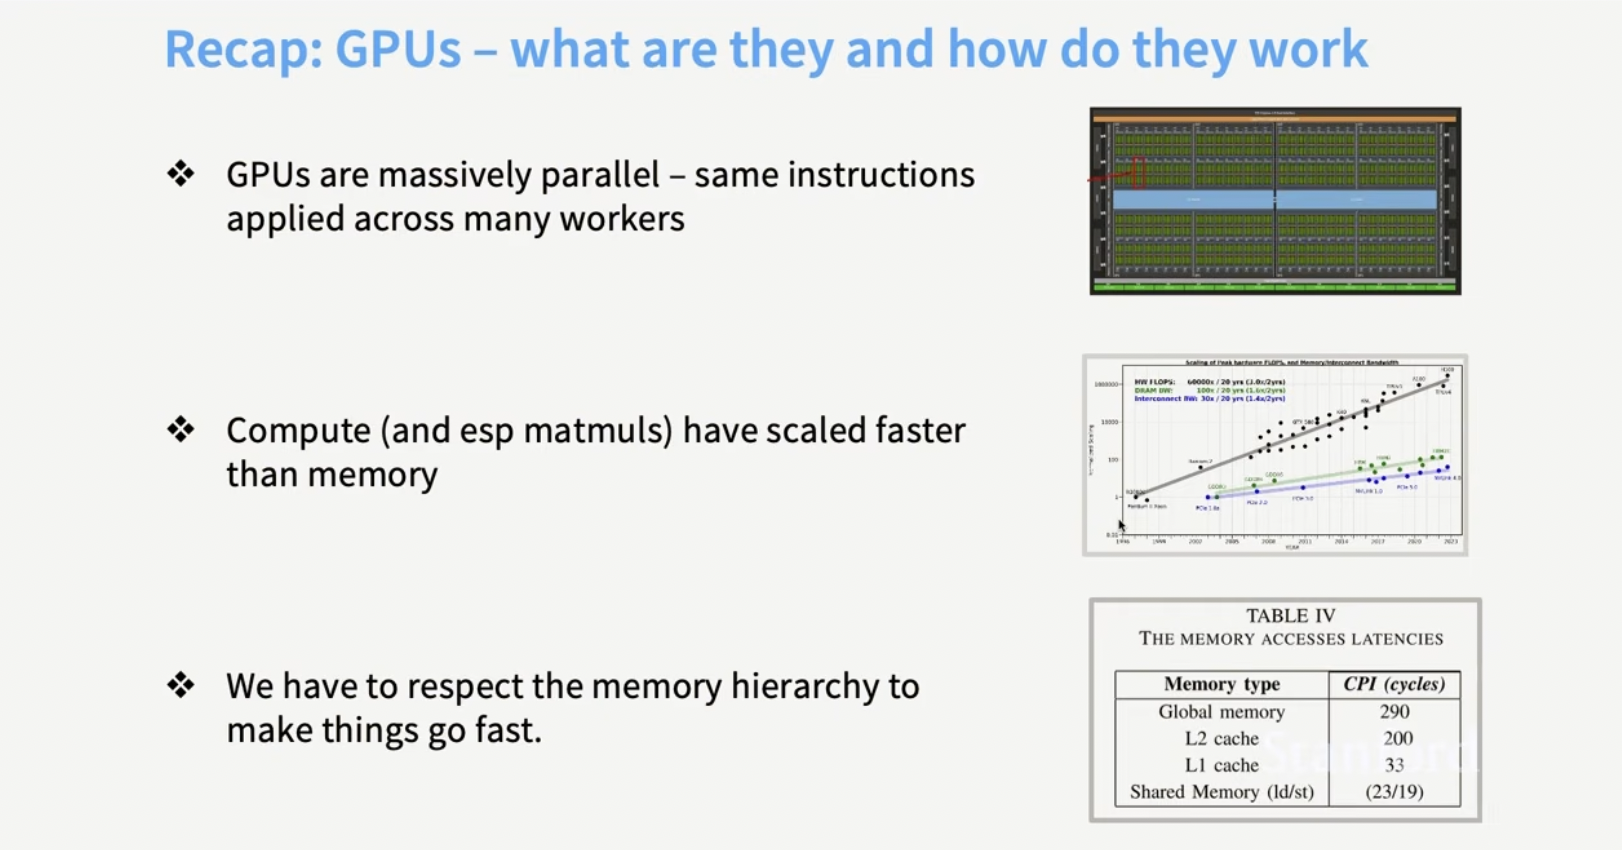
Matmulis faster than floating point operations (additions, multiplications) -
compute is scaling faster than memory
-
memory bandwidth is the bottleneck
Summary
Recent trends
-
Prefill phase is memory bound and is one chip
- Decoding is compute bound and is another chip
- attention can go to one chip; MLP will go to another chip
Recap
-
we do not get to control the L1 cache
-
physical distance makes it slower
-
We can do more operations per second than we can move data.
-
inference is more memory bound than training
Control divergence
-
SMIT thread
- On CPU
if-elseis easy - On GPU threads execute in groups of 32 (warps) and all threads in a warp must execute the same instruction.
- If some threads in a warp take the
if pathand others take theelse path,
Low precision computation
- number repreentation
-
fp16,
- half memory to move
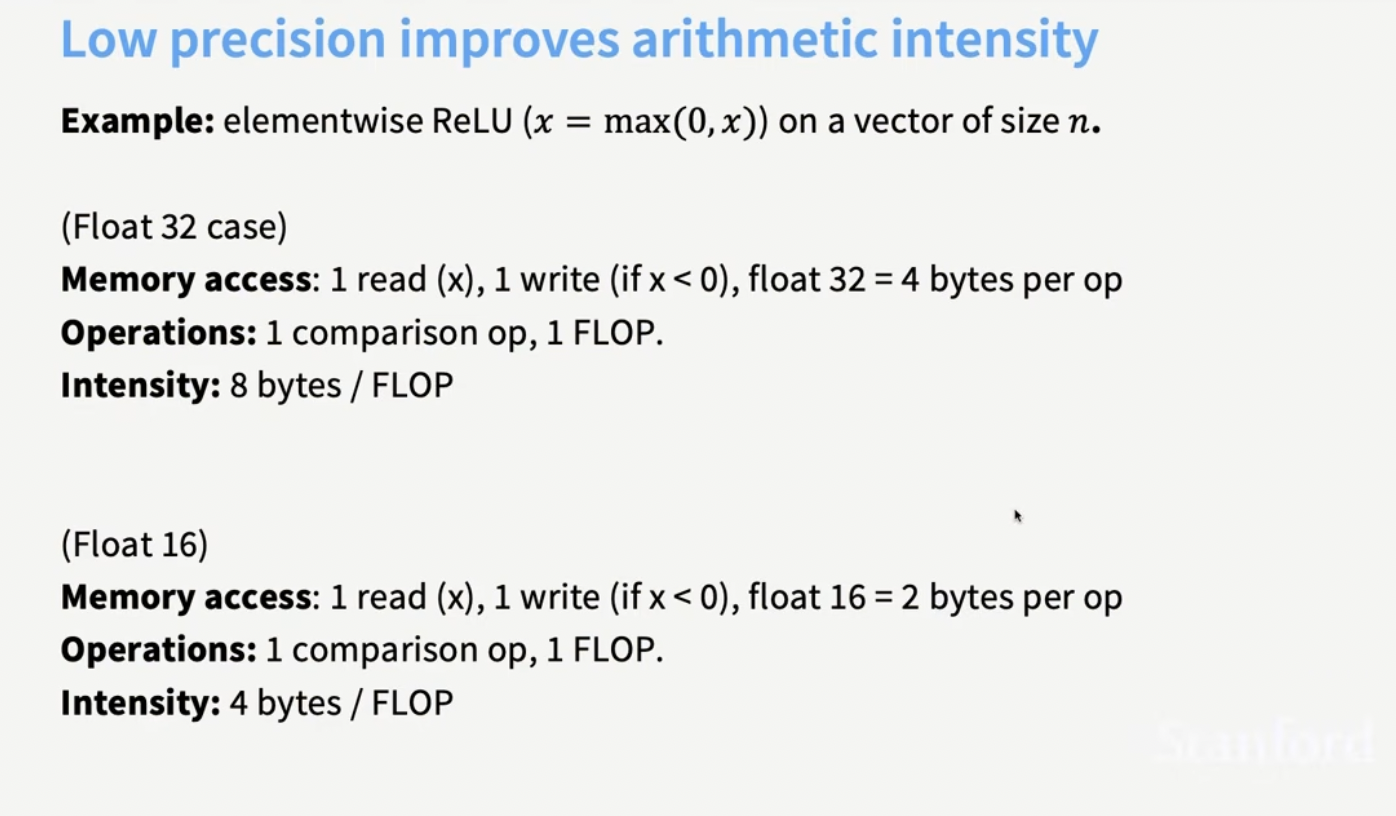
- low precision improves arithmetic intensity
-
weights and activations may be low precision for matrix multiplications
-
exponential and softmax need higher precision
-
Concept 🧩 🚀 empirical work on which of these operations can be low precision
-
with mixed precision, transpose becomes an expensive operation
-
🤔 ❓how to solve it?
-
- make two copies of the matrix
- one original and another for the transpose
- transposes are also quantized

-
what happens during training? what happens in inference?
-
matmulgetting quantized - if matmul is quantized, what does it mean?
- does it mean we dont use mixed precision during training?
-
does it mean we dont use low precision during training
- in inference we use lower precision ?
-
in training we use higher precision ?
-
📝 Write out other questions in assessments related to GPUs
-
can quantize activations after
ReLU -
however more bang by quantizing
matmul - train a bigger model and then quantize it?
Operator fusion
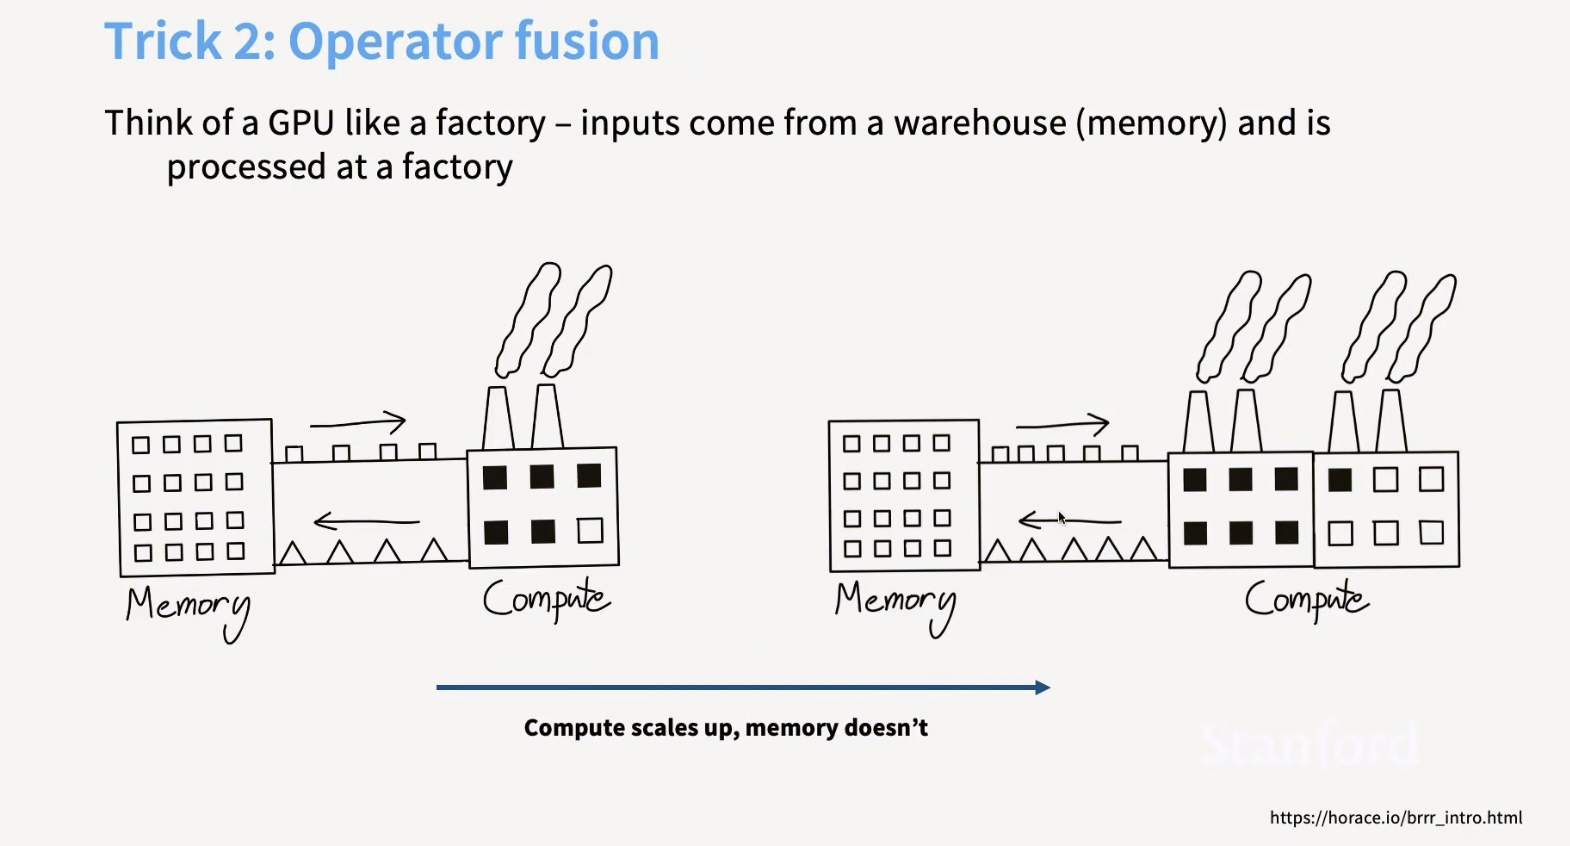
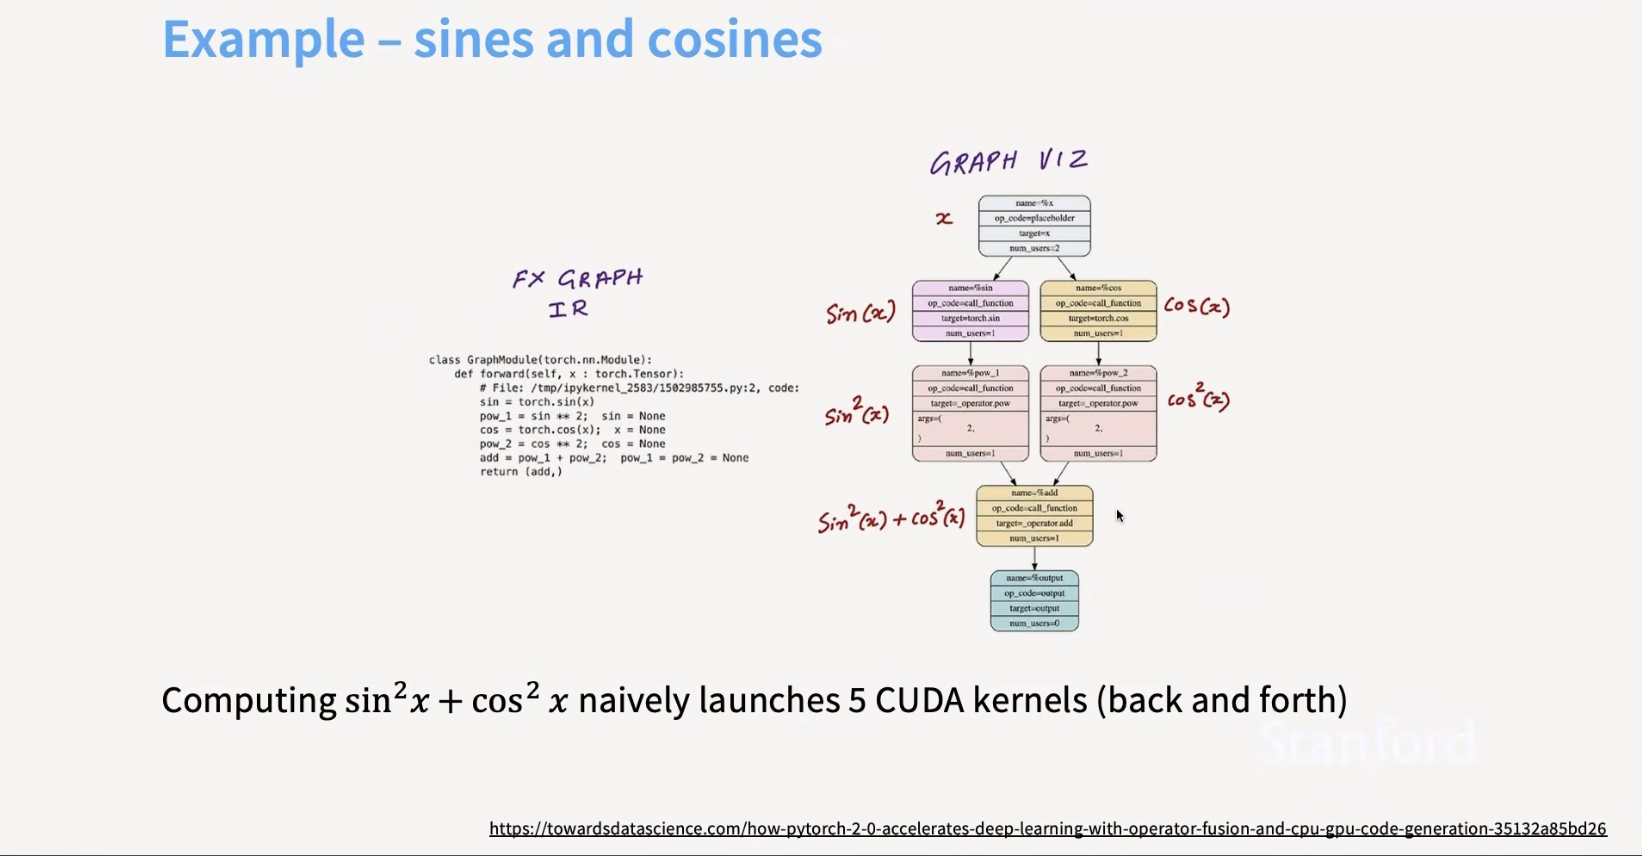
- how many cycles for computing sin^ x + cos^x ?
-
cuda.compilewill collapse the computation graph -
or read once in GPU memory, do the computation in SM and then write the result back to global memory
-
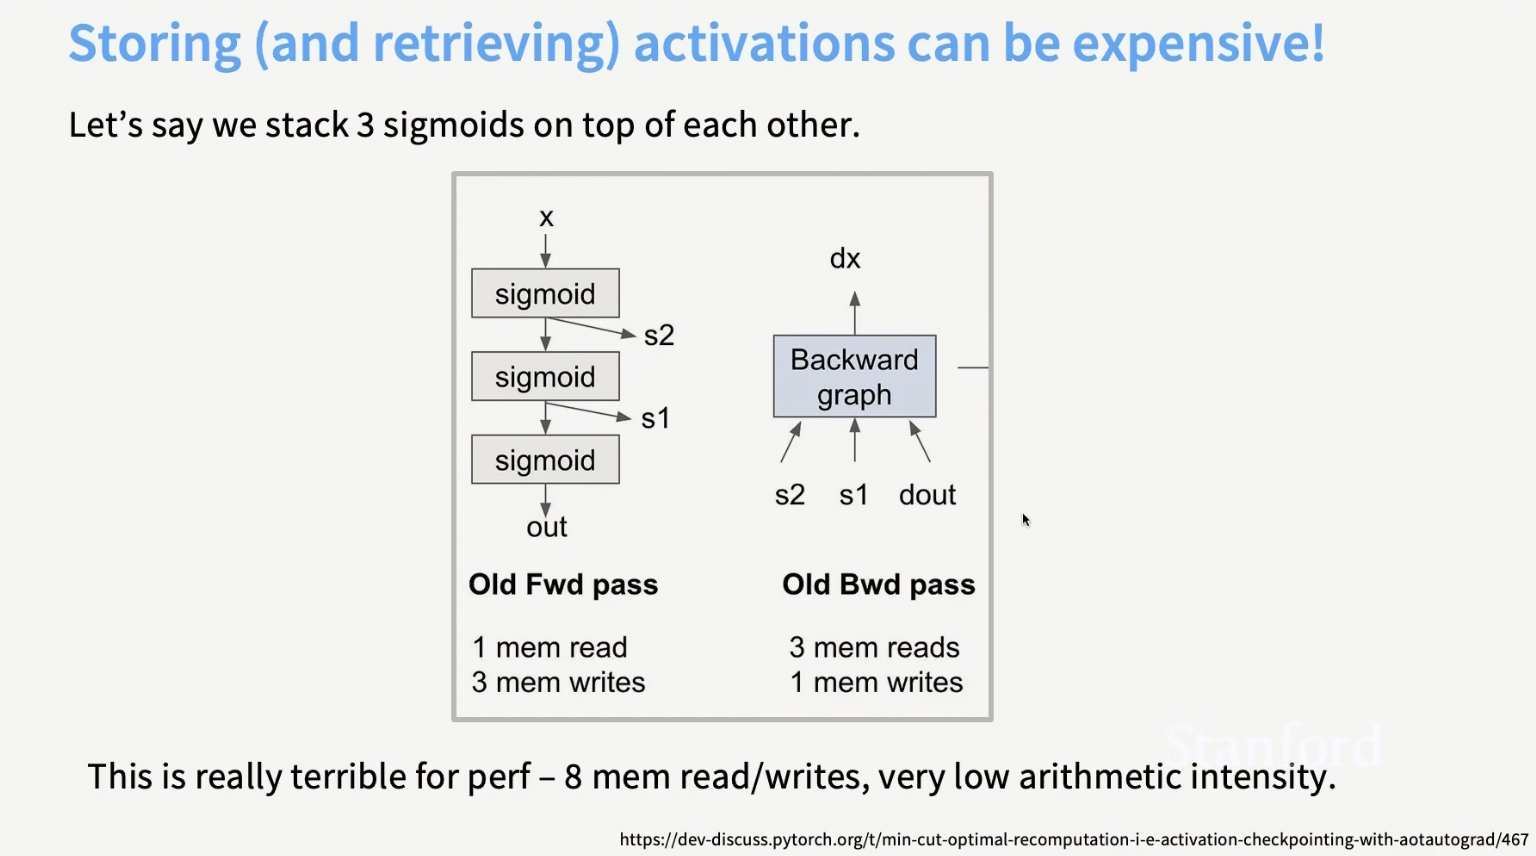
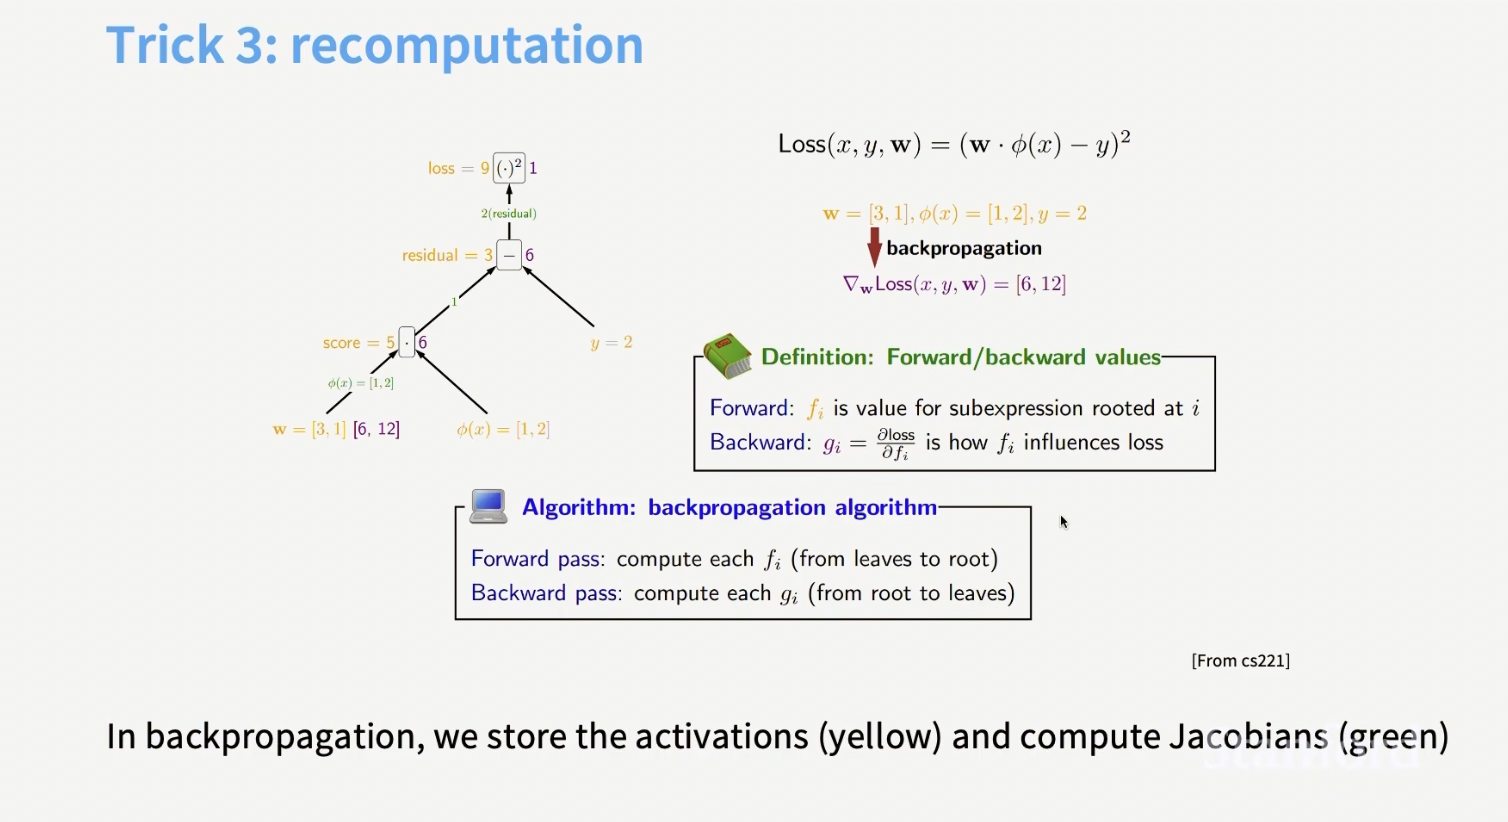
backprop memory used
-
Concept 🧩 🚀 backpropagation intuition
-
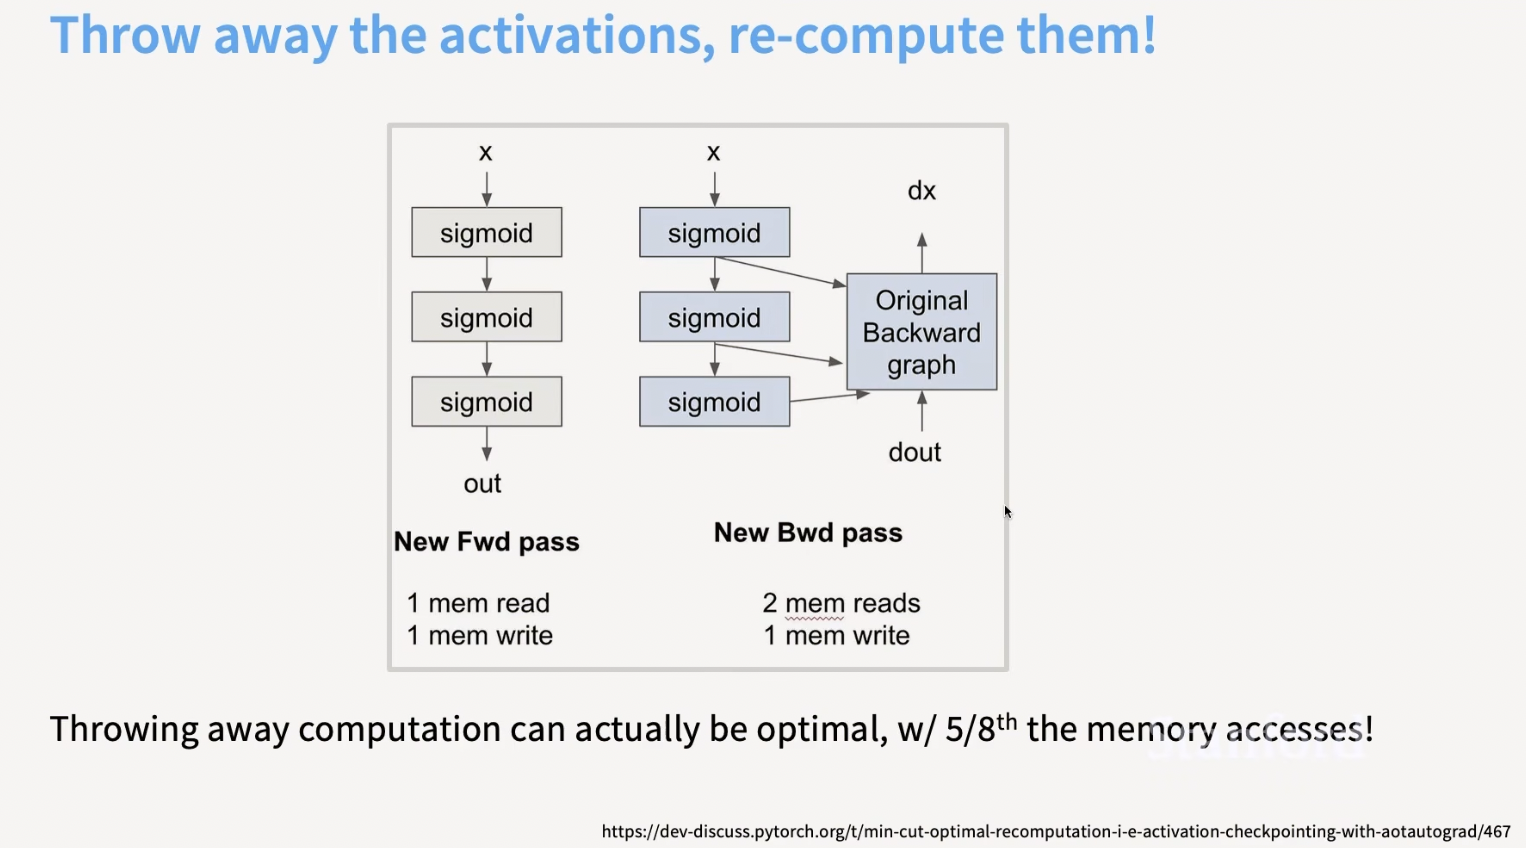
💡 in a world where memory is slower and compute is cheap/faster, you just recompute the activations!
Burst mode of DRAM/global memory
-
a single read will return 128 byte blocks
-
memory access is coalesced
-
NOTE: a
warpis a set of 32 threads that execute together and memory access happens together -
row addressing
-
coalescing for matrix multiplication (row major)
Tiling
-
respect memory hierarchy
-
cut your matrix into tiles
-
and compute your
matmul -
by loading them from global memory to shared memory
-
once in shared memory I can read and write very fast
-
🤔 ❓ Is this problem
NP-hard? -
TODO: Practical idea: PyTorch
maxautotunebenchmarking tile size and which is faster
Circling back to motivation
-
Matrix mystery 🧩 🚀: Why is it faster to have a bigger matrix?
-
Tweet by Andrei Karpathy
-
pad to get a speedup
-
shift your rows to get a speedup (tiling)
-
🤔 ❓ Now explain how you get this unexplained drop in throughput when you go from 98 tiles to 120 tiles on an A100
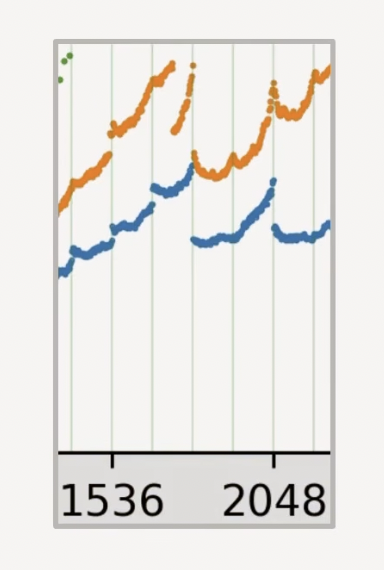
- wave quantization
Recap
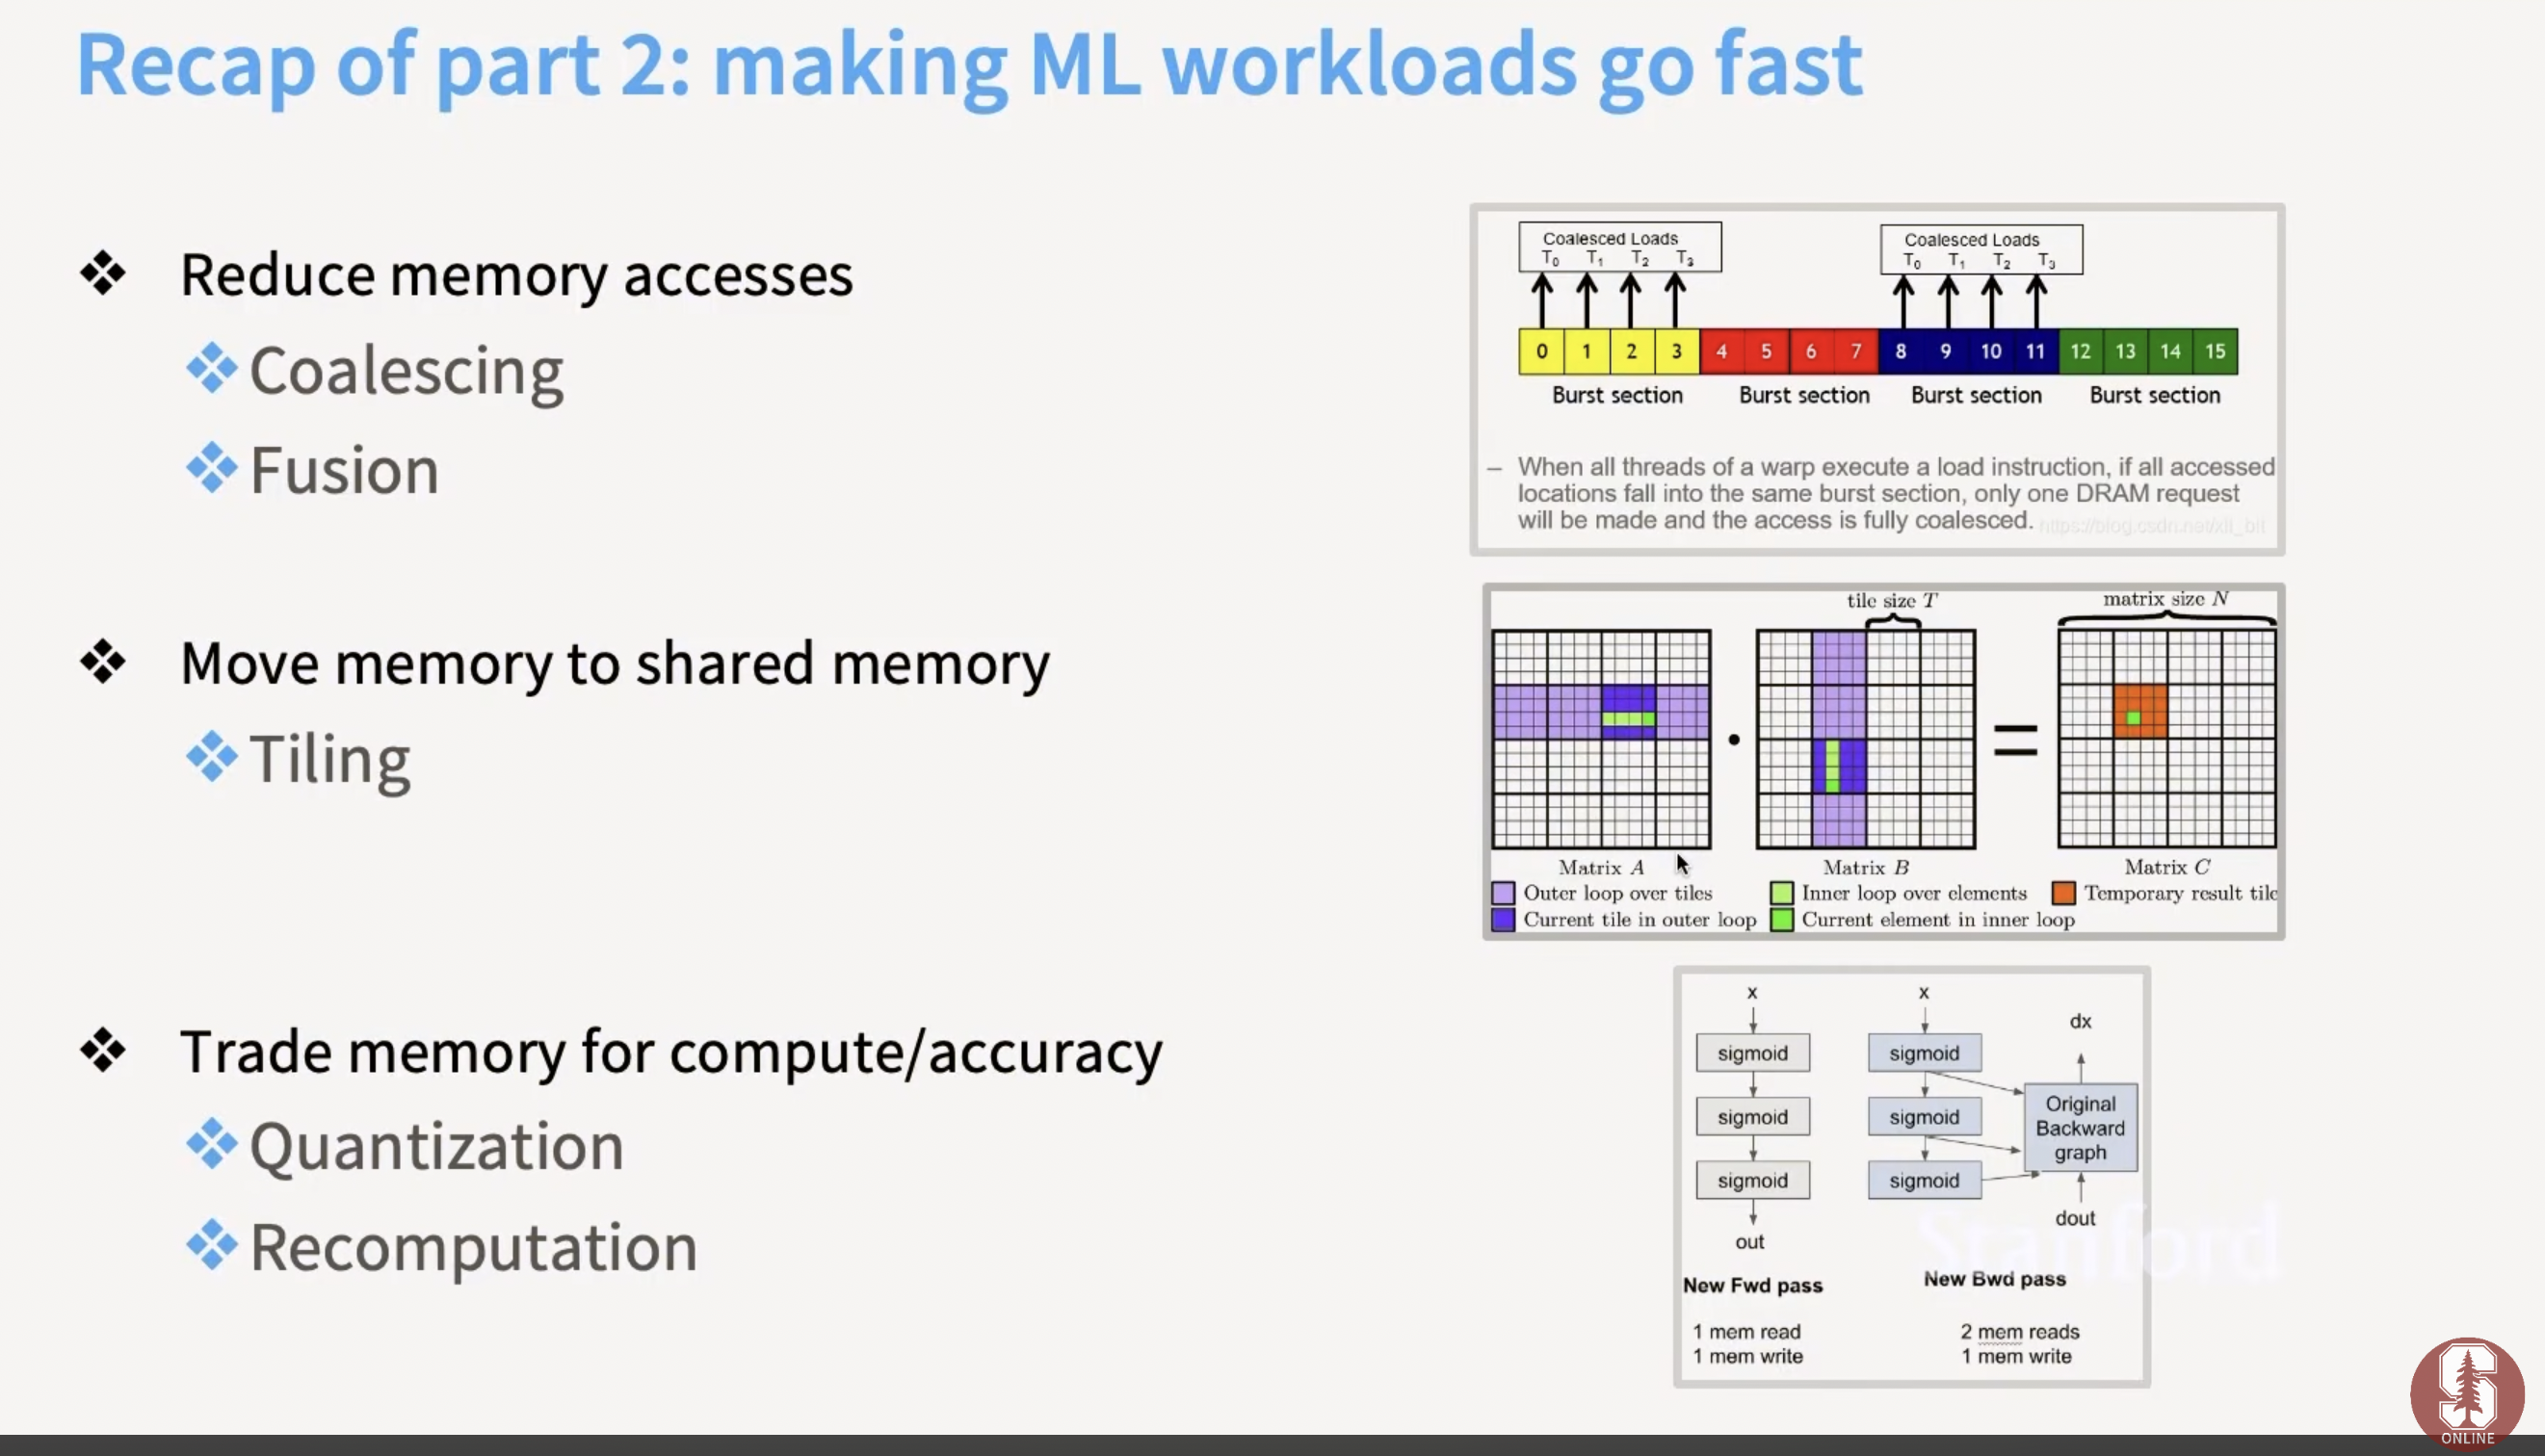
- SRAM energy hungry
Flash Attention
-
Also see Flash attention notes
-
Tiling and recomputation
-
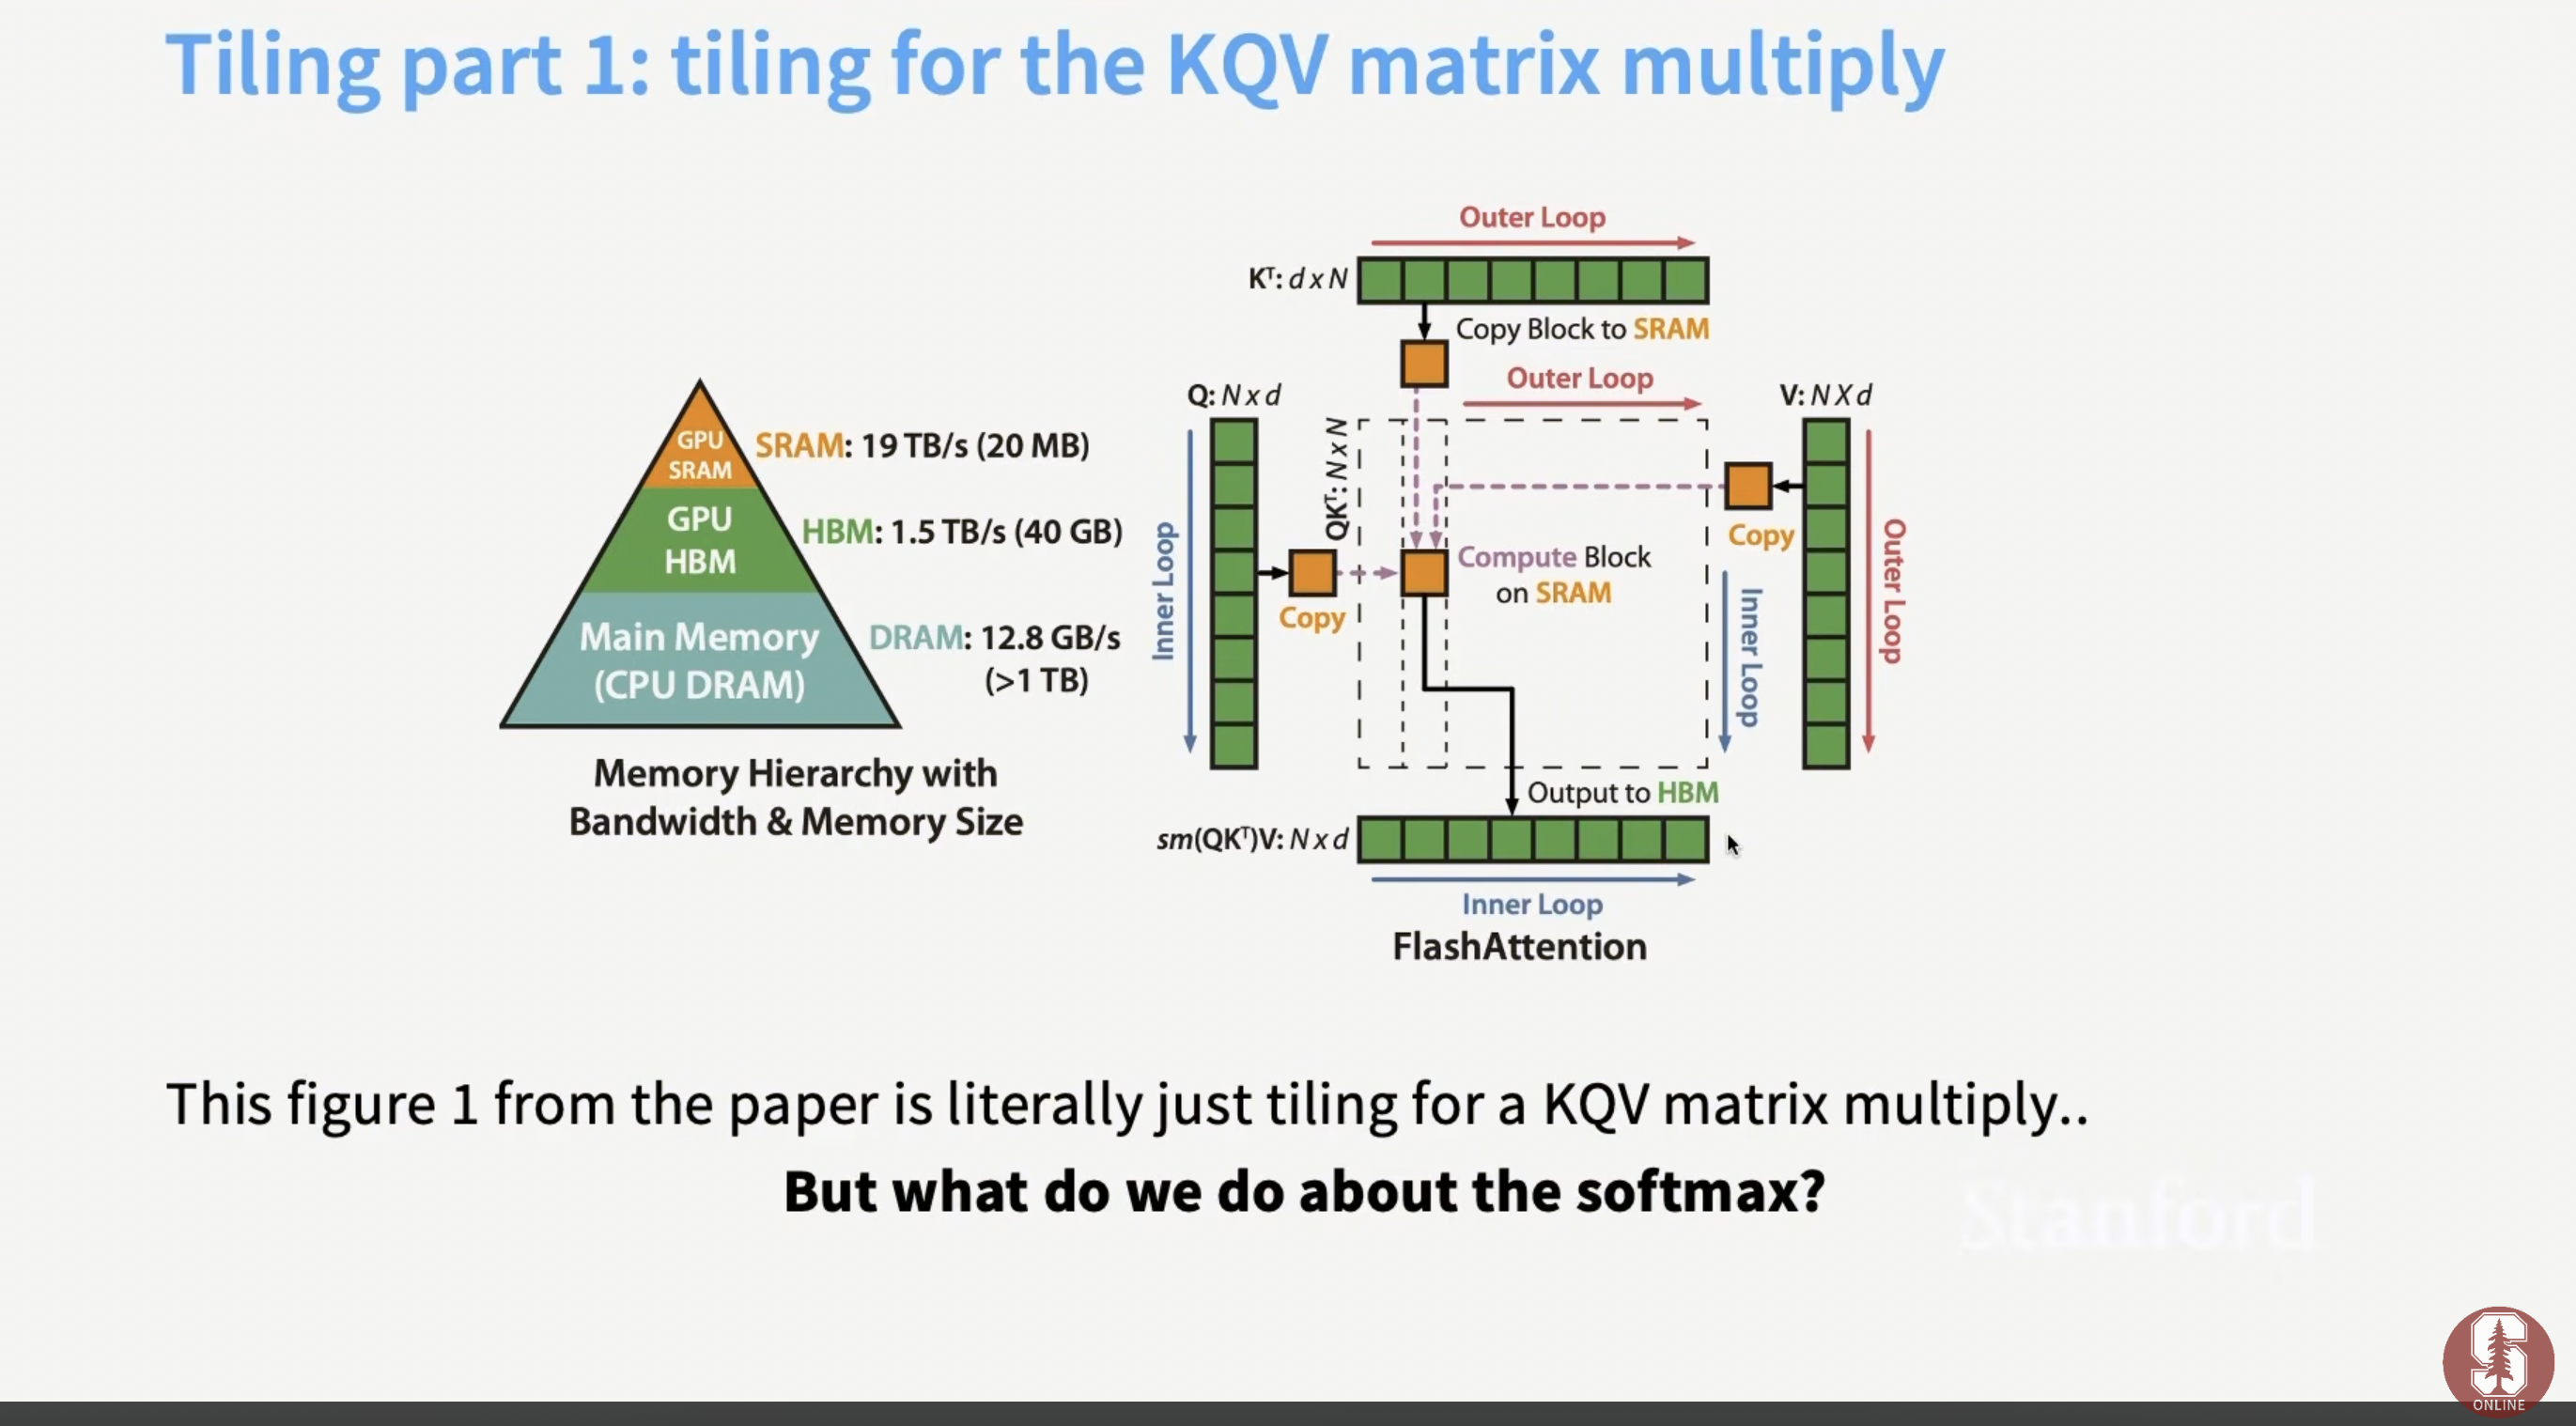
Recall: Attention is 3 matrix multiplies and a softmax
-
Tiling for KQV matrix multiply
-
softmax?
-
online softmax
-
calculate softmax tile-by-tile
-
incrementally update the max and setup a telescoping sum
-
forward pass in flash attention in HBM and SRAM
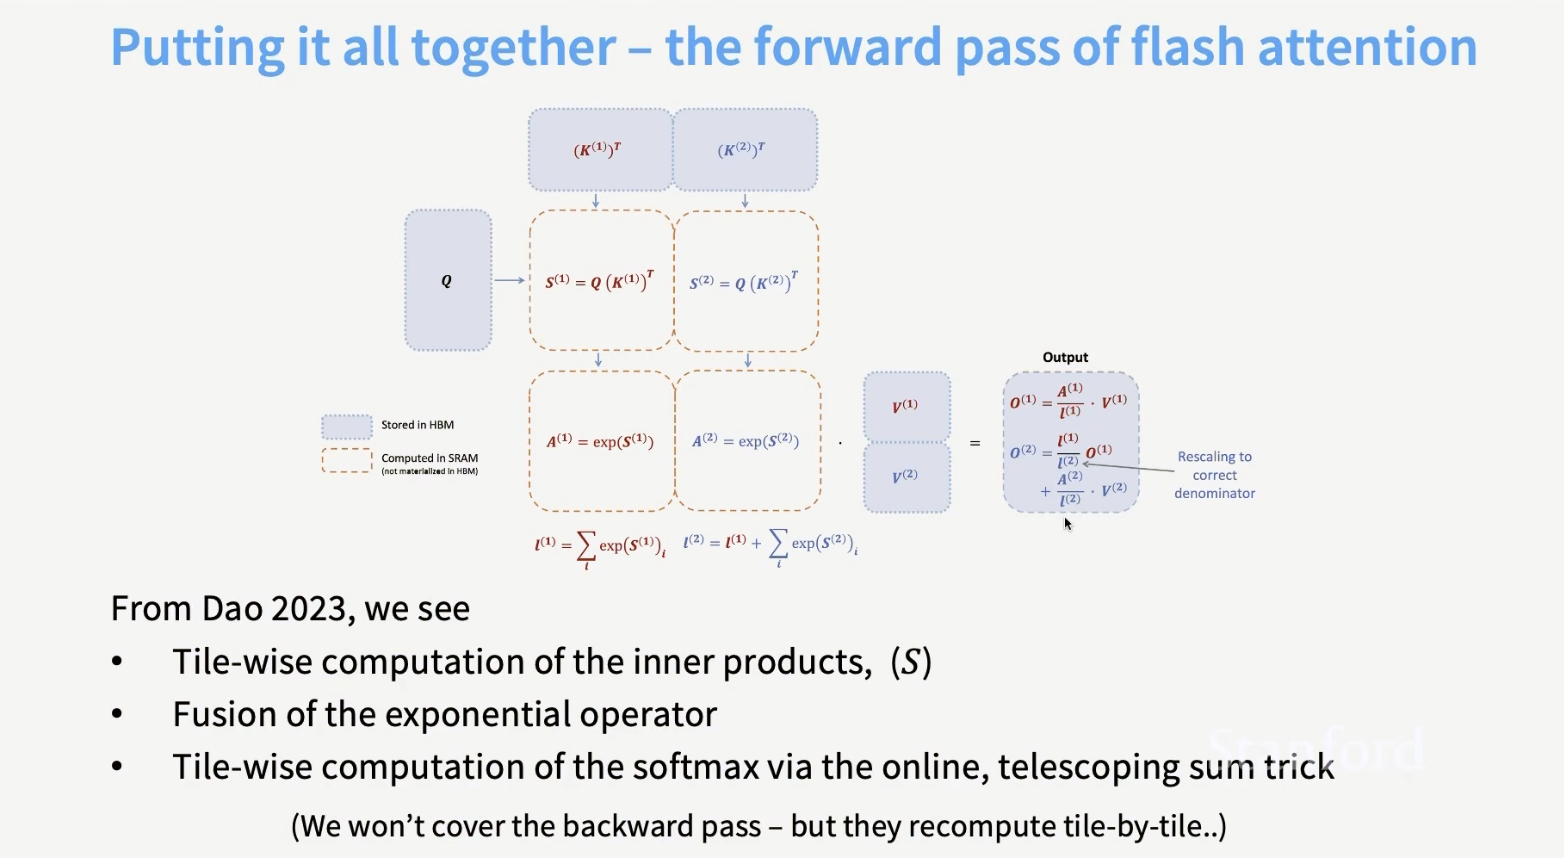
- recomputation: do not store activations in memory, just recompute on backward pass
Key takeaways
-
In GPU, think about
matmuland data movement -
Thinking carefully about memory: tiling, recomputation, operator fusion
-
Concept 🧩 🚀 architecture, systems and software interact
Benchmarking and profiling
-
do warmups since some things are lazy compiled
-
time it multiple times
-
torch.cuda.Event(enable_timing=True): start and stop timers -
torch.cuda.synchronize(): wait for all GPU operations to complete -
everything on GPU is asynchronous
-
profiler
-
torch.profiler.profile
add_profile = profile(run_operation2(dim=2048, operation = lambda a, b: a + b))
-
🎮🎥 also see video on benchmarking and profiling by Dr. Percy Liang Stanford CS336
-
PyTorch has built in GeLU approximation
import torch

def builtin_gelu(x: torch.Tensor):
    return torch.nn.functional.gelu(x, approximate="tanh")
-
🎮 more practical code here
-
In the context of GPUs and Large Language Models (LLMs), Triton (originally developed by OpenAI) is an open-source, Python-embedded domain-specific language (DSL) and compiler designed for writing highly efficient, custom GPU kernels
-
It acts as a middle ground between high-level frameworks like PyTorch and low-level GPU programming languages like CUDA (NVIDIA) or ROCm (AMD). Instead of writing complex C++ code, developers can write Pythonic code that Triton compiles directly into optimized machine instructions.
-
PyTorch 2.0+: Triton is the primary engine behind PyTorch Inductor (the default compiler backend for torch.compile). It automatically generates optimized Triton kernels for your model code.
-
vLLM: Popular inference engines like vLLM rely on Triton attention backends to compute heavy workloads like Paged Attention. This approach allows inference frameworks to stay lightweight and avoid heavy, vendor-specific binary dependencies.
import os
import time
from typing import Callable
import torch
from torch.profiler import ProfilerActivity
import triton
import triton.language as tl
from edtrace import text, link, image
from lecture_util import get_local_url
from gpu_util import cuda_if_available

def main():
    # Last lecture: high-level overview of GPUs and performance
    # This lecture: benchmarking/profiling + writing kernels
    # review_of_gpus()
    benchmarking_and_profiling()           # Where are the bottlenecks?
    naive_vs_builtin_vs_compiled_gelu()    # Apply it to the GeLU example
    # Write Triton kernels

def benchmarking_and_profiling():
    # Recipe for success:

    # Benchmark and profile your code

    # Make changes

    # Benchmark and profile your code again

    benchmarking()   # How long does it take?

    profiling()      # Where time is being spent?

    # Benchmark and profile your code!

def benchmarking():
    # Benchmarking measures the wall-clock time of performing some operation.
    # It only gives you end-to-end time, not where time is spent (profiling).
    # It is still useful for:

    # comparing different implementations (which is faster?), and

    # understanding how performance scales (e.g., with dimension).

    # You can use torch.utils.benchmark.
    # We will roll our own to make benchmarking more transparent.

    # Benchmark matrix multiplication

    matmul = run_operation2(dim=1024, operation=lambda a, b: a @ b)
    result = benchmark(matmul)

    # See how timing scales with dimension
    results = {}
    for dim in [256, 512, 1024, 2048, 4096, 8192]:
         results[dim] = benchmark(run_operation2(dim=dim, operation=lambda a, b: a @ b))
    # Note: time is roughly constant when dimension is small, then cubic scaling.

def benchmark(run: Callable, num_warmups: int = 1, num_trials: int = 3) -> float:
    """Benchmark `func` by running it `num_trials`.  Return the average time."""
    # Warmup: first times might be slower due to compilation, etc.
    # Since we will run the kernel multiple times, the timing that matters is steady state.
    for _ in range(num_warmups):
        run()
    torch.cuda.synchronize()  # Wait for CUDA threads to finish (important!)
    # Time it for real now!
    times: list[float] = []
    for trial in range(num_trials):  # Do it multiple times to capture variance
        # Use CUDA events for accurate GPU timing (avoid capturing CPU overhead)
        start_event = torch.cuda.Event(enable_timing=True)
        end_event = torch.cuda.Event(enable_timing=True)
        start_event.record()  # Start timing
        run()  # Actually perform computation
        end_event.record()  # End timing
        torch.cuda.synchronize()  # Wait for CUDA threads to finish
        times.append((start_event.elapsed_time(end_event)))

    mean_time = mean(times)
    return mean_time


def profiling():
    # While benchmarking looks at end-to-end time, profiling looks at where time is spent.
    # Independent of time, profiling also helps you understand what's going under the hood.
    # PyTorch has a built-in profiler.
    # In your assignment, you will use nsight to get more details.
    add(dim=2048)
    add_profile = profile(run_operation2(dim=2048, operation=lambda a, b: a + b))

    matmul_profile = profile(run_operation2(dim=2048, operation=lambda a, b: a @ b))

    matmul_profile = profile(run_operation2(dim=128, operation=lambda a, b: a @ b))


def naive_vs_builtin_vs_compiled_gelu():
    # Let's benchmark and profile the GeLU activation function.
    x = torch.tensor([1.])
    # 1. Implementation naively from scratch in PyTorch (non-fused)
    y1 = naive_gelu(x)
    # 2. Built-in PyTorch implementation (fused)
    y2 = builtin_gelu(x)

    check_equal_1d(naive_gelu, builtin_gelu)  # Check it works
    # 3. Use PyTorch compiler on the naive implementation
    compiled_gelu = torch.compile(naive_gelu)

    y3 = compiled_gelu(x)

    check_equal_1d(naive_gelu, compiled_gelu)  # Check it works (compilation shouldn't change semantics)
    # Benchmarking
    naive_time = benchmark(run_operation1(dim=16384, operation=naive_gelu))

    builtin_time = benchmark(run_operation1(dim=16384, operation=builtin_gelu))

    compiled_time = benchmark(run_operation1(dim=16384, operation=compiled_gelu))
    # The builtin and compiled versions are significantly faster!
    # To understand why, let's look at the profiler to see where time is being spent.
    # naive_gelu
    naive_gelu_profile = profile(run_operation1(dim=16384, operation=naive_gelu))
TODO 📚: Questions Assignment
-
TODO 📚: question written assignment on this (theory)
-
see assessments
🎮 TODO Practical
-
TODO: In GPU, think about
matmuland data movement -
TODO: Flash Attention in pytorch
-
TODO 🎮 Practical see Stanford CS365 practical on GPUs here
-
Practical on counting FLOPS using
PyTorchand here usingTorchDispatchMode