visualization_lecture
![]()
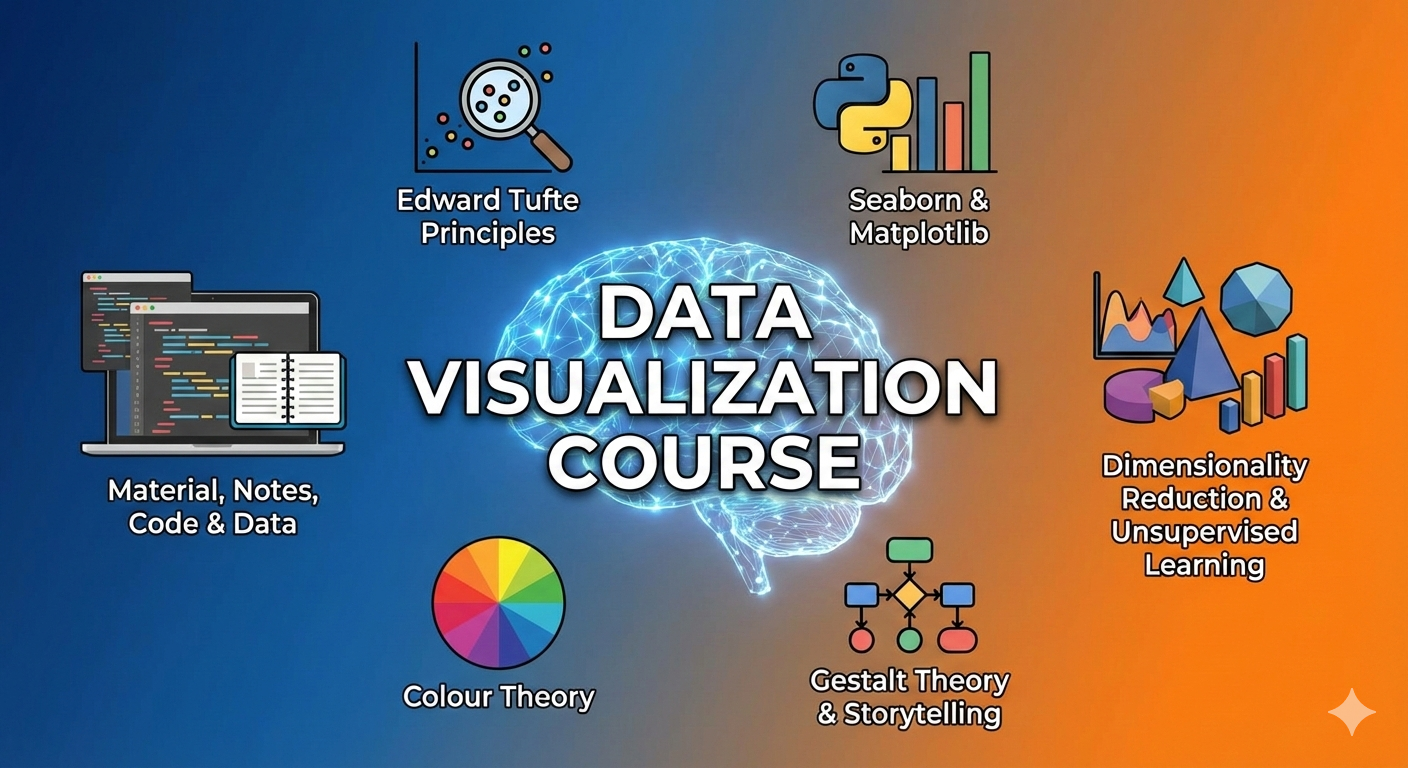
Introduction
Material, notes, code and data for teaching visualization, dimensionality reduction and mathematics of machine learning.
Talks
Slides
Installation
Install Python and the required packages
python -m venv venv_viz
source venv_viz/bin/activate
pip install -e requirements.txt
Course content
-
Exercises in Python on storytelling and narrative gap Week 2 and notebook and
-
Exercise COMPAS recidivism dataset visualization and bias in data
-
Interactive plots using ipywidgets and Interactive plots using plotly
-
Spatial plotting using Folium and John Snow cholera visualizations and activities
-
Lecture and assignments on Edward Tufte’s principles of data visualization
-
Colab Notebook on Edward Tufte’s principles of data visualization
Declaration
Generative AI tools were used in creating these resources. All content was independently verified by the author.
Notes
Some notes, mathematical proofs, concepts and activities are here:
https://github.com/neelsoumya/visualization_lecture/blob/main/mathematics_data_science.pdf
https://osf.io/mnh8d/
https://www.researchgate.net/publication/375186575_Everything_you_wanted_to_know_about_the_mathematics_of_dimensionality_reduction_and_visualization_but_were_afraid_to_ask_Teaching_resources_and_activities
Code
Code for visualization in R, model diagnostics and linear mixed effects models
https://github.com/neelsoumya/anova_linear_mixed_effects_examples
Rmarkdown package using Tufte’s principles
https://github.com/rstudio/tufte
Resources
-
Thinking outside the 10 dimensional box
https://www.popularmechanics.com/science/math/a27737/visualize-higher-dimensions/
https://youtu.be/zwAD6dRSVyI
- University of Cambridge data visualization resources
https://cambiotraining.github.io/visual-data-communication/materials/functions-and-objects.html
- Different kinds of cartographic projections
https://whereexactlymaps.com/blogs/articles/an-introduction-to-map-projections
https://www.viewsoftheworld.net/?p=752
- Great talks on visualization and how to do it right
https://www.youtube.com/watch?v=iipVlV4I_Vg&list=PLB2SCq-tZtVnXalwtfVPcjwy0xJbu-btN&index=4
- Minard drawing (The best statistical graphic ever drawn)
https://www.edwardtufte.com/tufte/minard
code for analysing this data
https://github.com/joannecheng/napoleon_analysis
https://thoughtbot.com/blog/analyzing-minards-visualization-of-napoleons-1812-march
- Tufte’s principles in R
https://jtr13.github.io/cc19/tuftes-principles-of-data-ink.html
- Data visualization excellence
https://classes.engr.oregonstate.edu/eecs/winter2018/cs519-400/modules/4-data-visualization/1-excellence-integrity/
- Visualization projects
https://nagix.github.io/
- Good and bad visualizations
https://policyviz.com/2023/02/07/10-ways-to-mislead-with-data-visualization/
https://wpdatatables.com/data-visualization-examples/
https://wpdatatables.com/misleading-data-visualization-examples/
https://www.qlik.com/us/data-visualization/data-visualization-examples
https://policyviz.com/2020/08/10/on-diverging-color-palettes-in-maps/
https://www.oldstreetsolutions.com/good-and-bad-data-visualization
https://viz.wtf/
https://r-graph-gallery.com/
- Visualization alternatives
https://dominicroye.github.io/blog/2025-12-14-broken-charts/ <!–
Video lectures
https://www.youtube.com/watch?v=ZDSj-jEoaoc –>
Installation
-
Install R
https://www.r-project.org/
-
and R Studio
https://www.rstudio.com/products/rstudio/download/preview/
- Install the following packages in R:
install.packages('rmarkdown')
install.packages('knitr')
install.packages('tinytex')
install.packages('sqldf')
install.packages('ggplot2')
install.packages('gplots')
install.packages('lme4')
install.packages('lmerTest')
install.packages('pROC')
install.packages('precrec')
install.packages('PRROC')
install.packages('boot')
install.packages('mlbench')
install.packages('caret')
install.packages('rpart')
install.packages('partykit')
install.packages('rlib')
devtools::install_github('neelsoumya/rlib')
install.packages('multcomp')
install.packages('lsmeans')
install.packages('moments')
- Download a zip file of this repository and unzip it
or
clone it
git clone https://github.com/neelsoumya/teaching_reproducible_science_R

cd teaching_reproducible_science_R
- Go to this new directory and set working directory to this directory in R.
setwd('~/teaching_reproducible_science_R')
- In R studio, run the markdown
rmarkdown.rmd
https://github.com/neelsoumya/teaching_reproducible_science_R/blob/main/rmarkdown.rmd
Template code
rmarkdown.rmd
https://github.com/neelsoumya/teaching_reproducible_science_R/blob/main/rmarkdown.rmd
Running this will create a report like the following:
https://github.com/neelsoumya/teaching_reproducible_science_R/blob/main/rmarkdown.pdf
Exercises
- Create an Rmarkdown for the Boston housing dataset. See the tutorial below and just load and plot the data.
https://medium.com/analytics-vidhya/a-simple-ml-project-in-r-using-the-boston-dataset-e1143146ffb0
- A simple script to help you get started is here
simple_script.R
https://github.com/neelsoumya/teaching_reproducible_science_R/blob/main/simple_project.R
Resources and further reading
https://rmarkdown.rstudio.com/lesson-1.html
https://bookdown.org/yihui/rmarkdown-cookbook/
https://ropensci.org/
https://bookdown.org/home/
https://github.com/neelsoumya/dsSurvival_bookdown
https://www.coursera.org/learn/r-programming
https://swcarpentry.github.io/r-novice-gapminder/guide/index.html
https://github.com/aaronpeikert/repro-workshop
Lecture notes outline
https://github.com/neelsoumya/teaching_reproducible_science_R/blob/main/slides.pdf
-
Your data, your model decisions, parameters and your data filtering decisions will keep on changing. How do you know 6 months later what has changed? Document your code and your output and your design decisions all in one place.
-
Reproducible pipeline
-
Know exactly what changed and when
-
Know how to rerun the analysis and get the (same) results
-
This is like your research notebook
-
Some experiences/case studies of using Rmarkdown notebooks and helping biologists use them to analyze their own data (30 minute talk)
-
When you are deep in your work, it can be difficult to make code pretty, comment it and make it reproducible. But you will regret not doing this when you park the work and 6 months later your colloaborators/reviewers ask for additional analysis or changing some assumption, etc. Your code should then be ready (you should be able to click a button and reproduce the figures for your paper).
-
Example of IL10 project (tSNE and heatmaps from a bioinformatics project)


- You can easily create R packages or Rmarkdown documents in R Studio (see screenshots in this folder/repository and below)
-
You can also easily create graphical user interfaces
Here is a demo:
https://sb2333medschl.shinyapps.io/shinyapp/
and code
app.R:https://github.com/neelsoumya/teaching_reproducible_science_R/blob/main/shinyapp/app.R
-
The concepts are the same in any programming language (R/Python)
-
Bottomline: we are all busy and we would all rather publish papers, but in the long term these best practices will make us more productive
-
This is like protocols (used in experimental biology) for computer scientists. Also like a lab notebook but for computational people.
-
You can also write an entire paper in R markdown, where each figure is generated from the code
-
A short demonstration in R studio of how to create an R markdown document
-
A bridge into R and Python: issues with each (Ahmad and Soumya). Pandocs solution by Neil.
See
tst.mdfile.https://github.com/neelsoumya/teaching_reproducible_science_R/blob/main/tst.md
Command is
pandoc tst.md -o test.ipynb
Code examples
- A very simple R markdown will look like the following
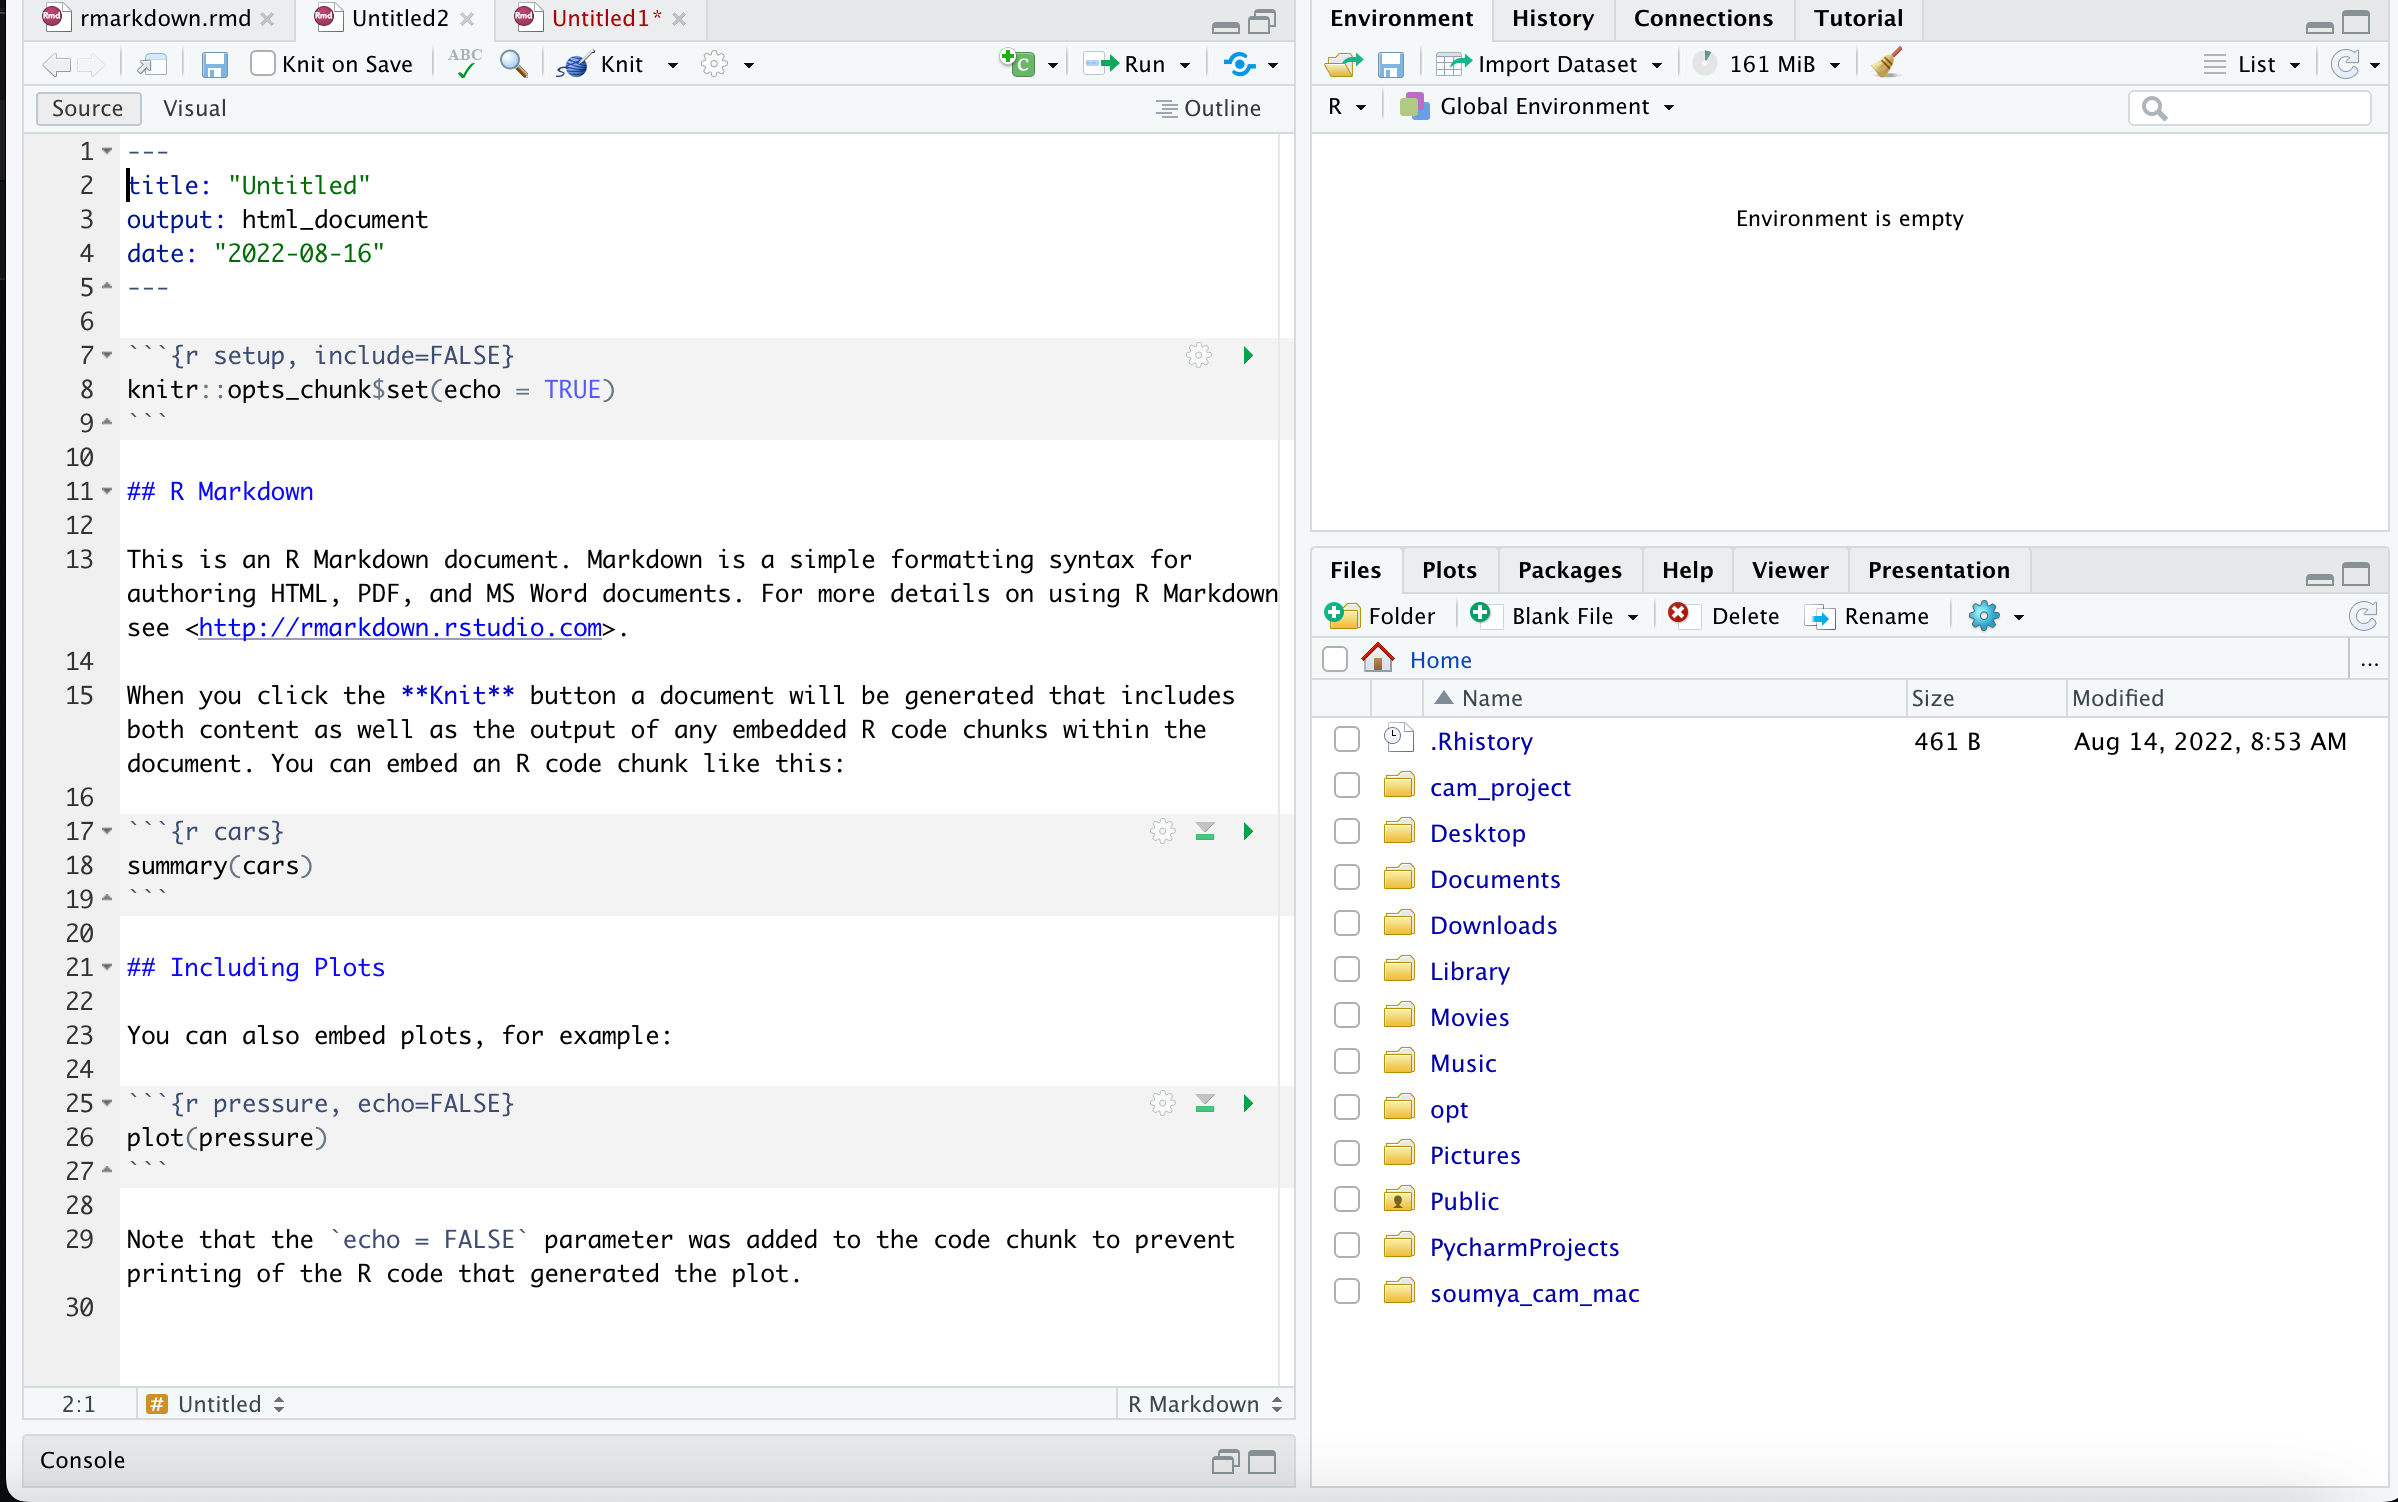
- Here are some very simple commands that you use to generate your document (you write your code in R and it gets compiled into a document like PDF)
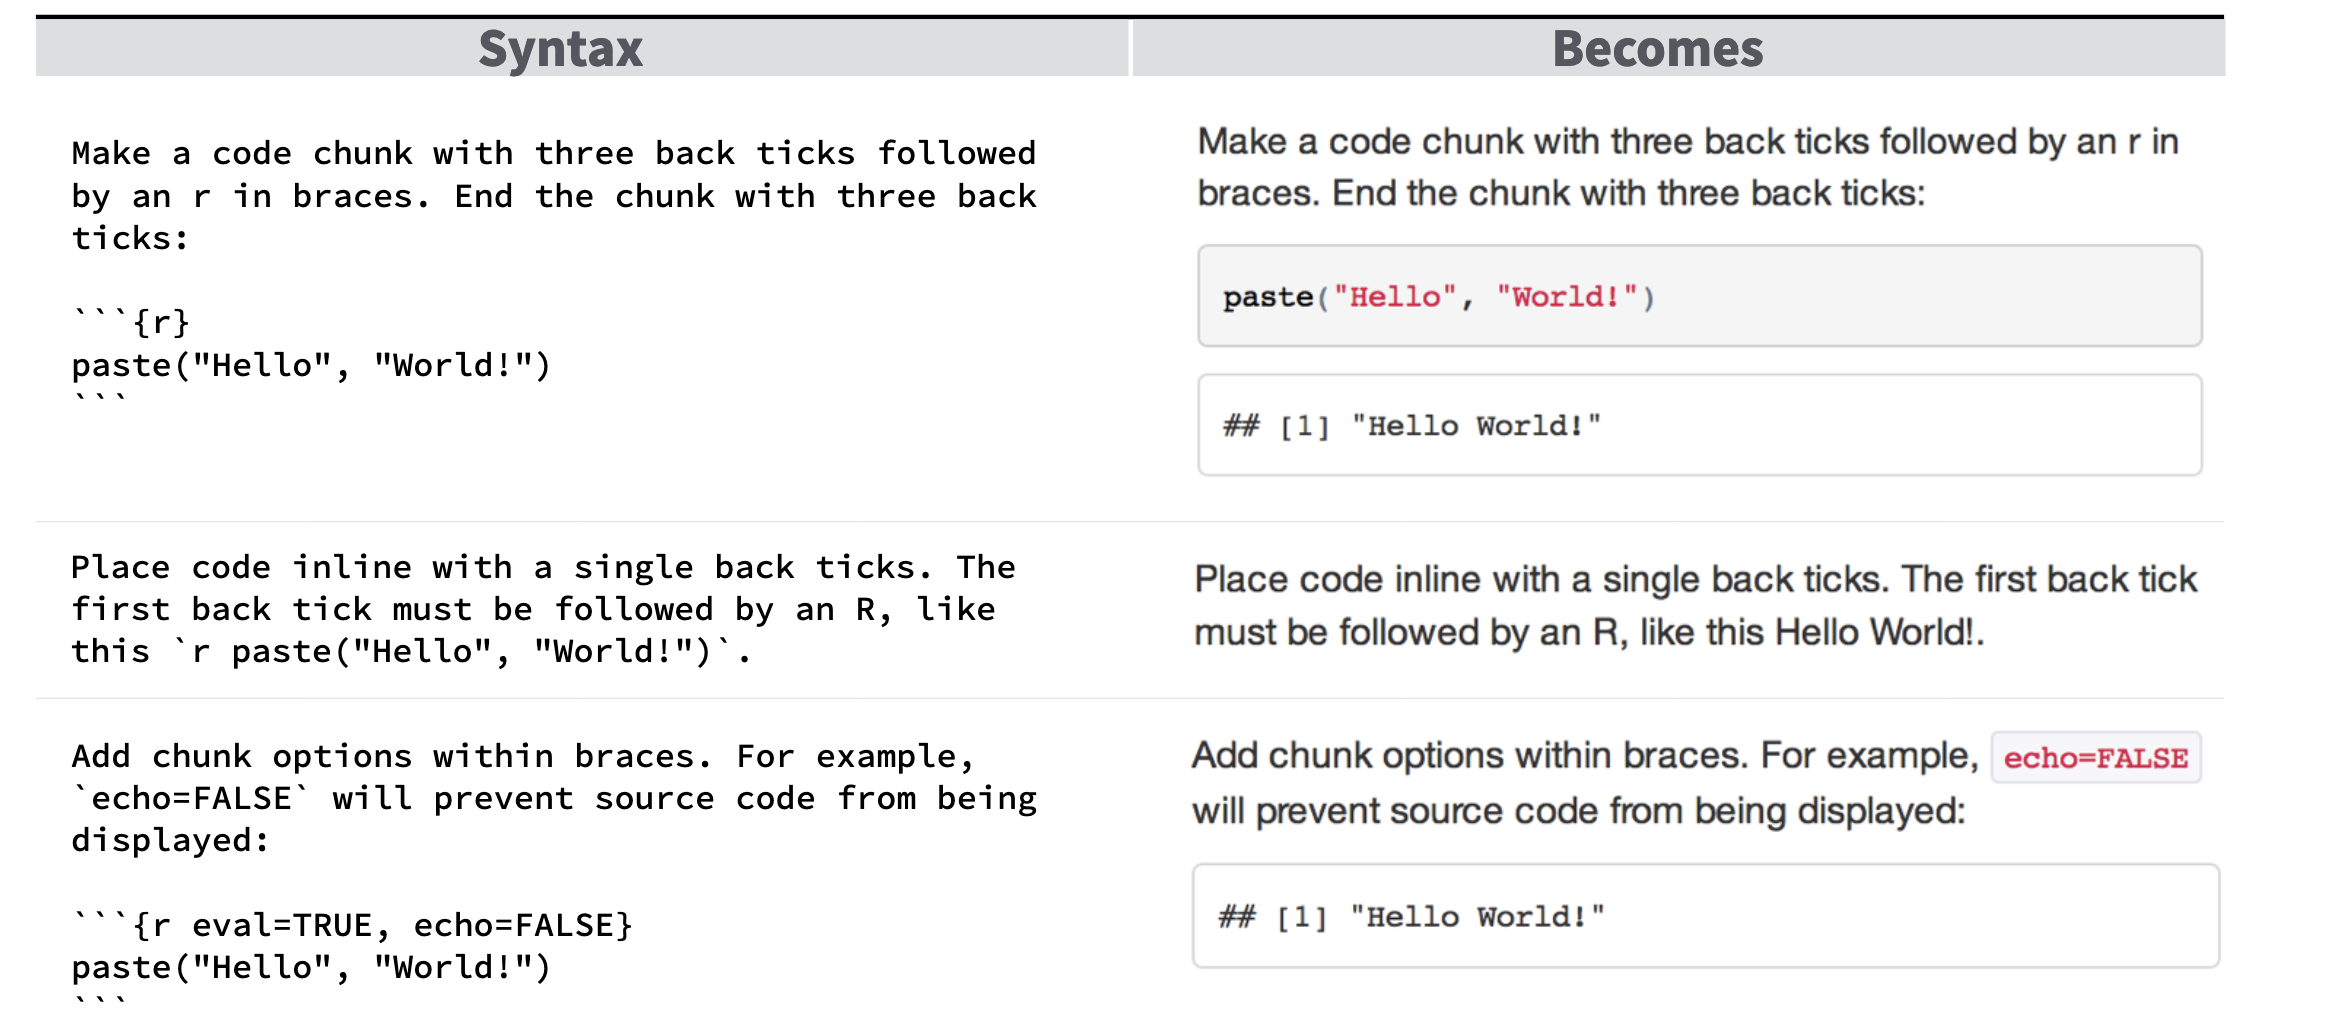
See the link below for more details
https://www.rstudio.com/wp-content/uploads/2015/03/rmarkdown-reference.pdf
- Now head over to the file named
rmarkdown.rmd
https://github.com/neelsoumya/teaching_reproducible_science_R/blob/main/rmarkdown.rmd
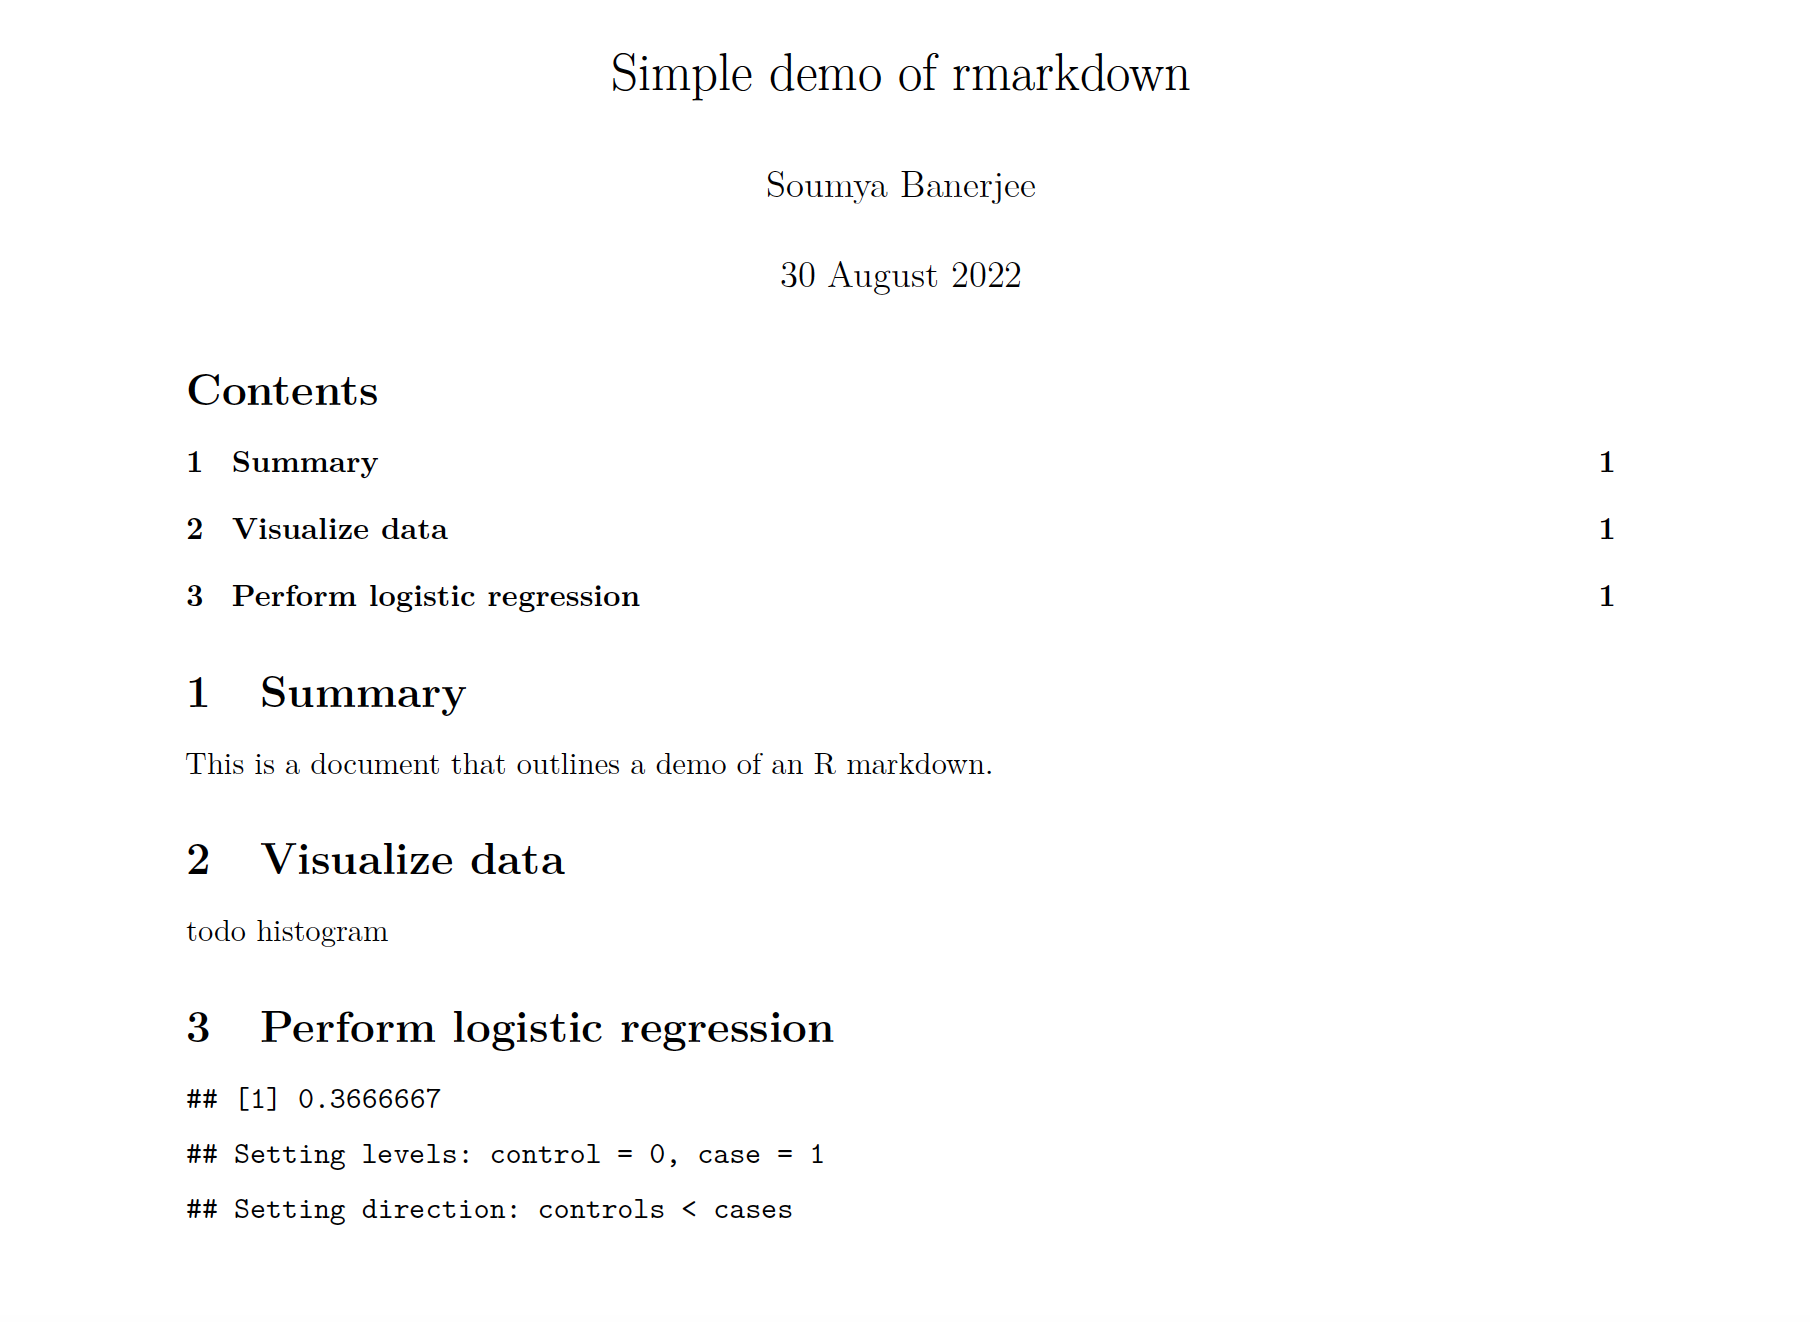
Running this will create a report like the following:
https://github.com/neelsoumya/teaching_reproducible_science_R/blob/main/rmarkdown.pdf
- A typical header of a R markdown file will look like
---

title: "Analysis and Writeup"

header-includes:

- \usepackage{placeins}

- \usepackage{float}

- \floatplacement{figure}{H}

output:

  pdf_document:

    fig_caption: yes

    keep_tex: yes

    latex_engine: xelatex

    number_sections: yes

  word_document: default

  html_document:

    df_print: paged

bibliography: Periphery_project.bib

urlcolor: blue

---

```{r include=FALSE}

knitr::opts_chunk$set(echo = TRUE)

knitr::opts_chunk$set(cache = TRUE)

knitr::opts_chunk$set(warning = FALSE)

knitr::opts_chunk$set(out.extra = '')

#knitr::opts_chunk$set(fig.pos = 'H')
\begin{centering}
\vspace{3 cm}
\Large
\normalsize
Soumya Banerjee, r format(Sys.time(), "%b %d %Y")
\vspace{3 cm}
\end{centering}
\setcounter{tocdepth}{2}
\tableofcontents
\newpage
library(knitr)

library(gridExtra)

library(rmarkdown)

# EQUATIONS in rmarkdown

$$ eGFR = eGFR_{0} + b_{before}*t_{before} $$
Italics in rmarkdown using metafor
Code can be rendered or shown in rmarkdown using
dsBaseClient::ds.summary(x='surv_object')
```{r, include=FALSE}
Load packages and settings
library(sqldf)
library(ggplot2)
library(knitr)
library(rmarkdown)
library(gplots)
library(RColorBrewer)
library(png)
library(grid)
library(gridExtra)
library(lme4)
library(lmerTest)
library(rpart)
```{r, echo=FALSE}

# code here
Acknowledgements
Neil Lawrence, Carl Henrik Ek, Joyeeta Ghose
Contact
Soumya Banerjee
sb2333@cam.ac.uk
![]()